. 2015 Dec;41(6):1515-23.
doi: 10.1037/a0039653. Epub 2015 Aug 31.

Pointing, looking at, and pressing keys: A diffusion model account of response modality

Affiliations

Pointing, looking at, and pressing keys: A diffusion model account of response modality

Pablo Gomez et al. J Exp Psychol Hum Percept Perform. 2015 Dec.

Abstract

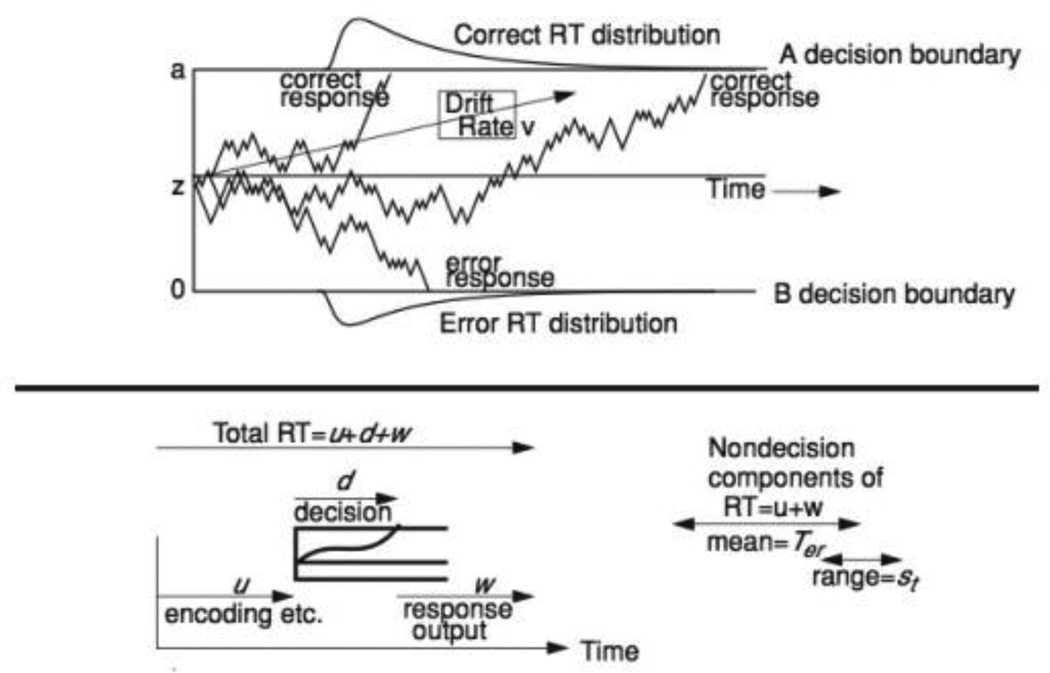
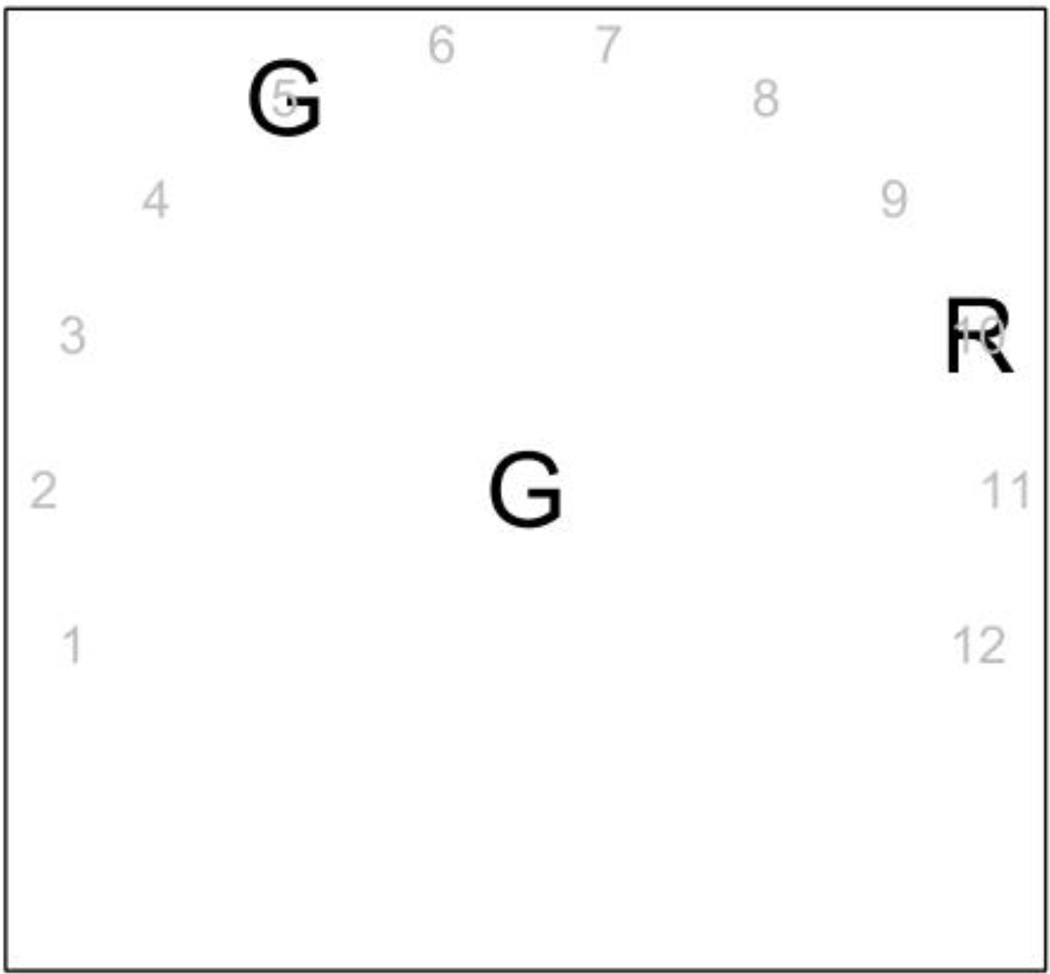
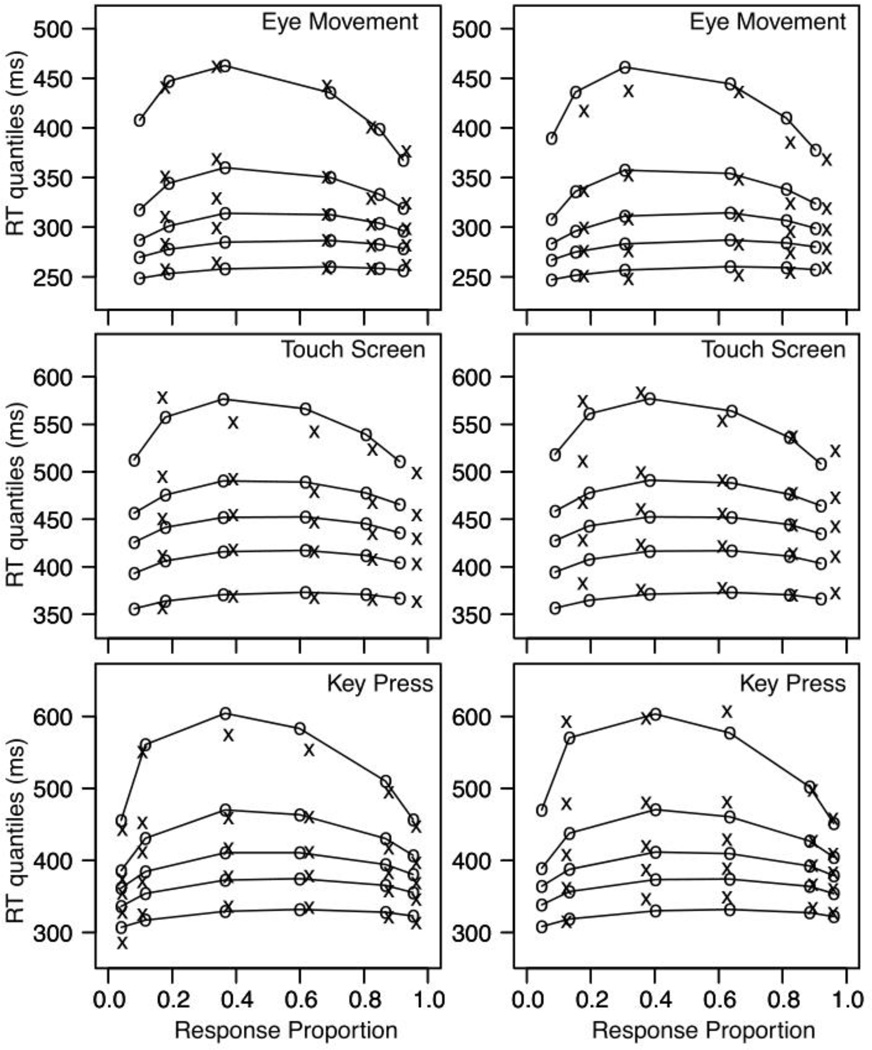
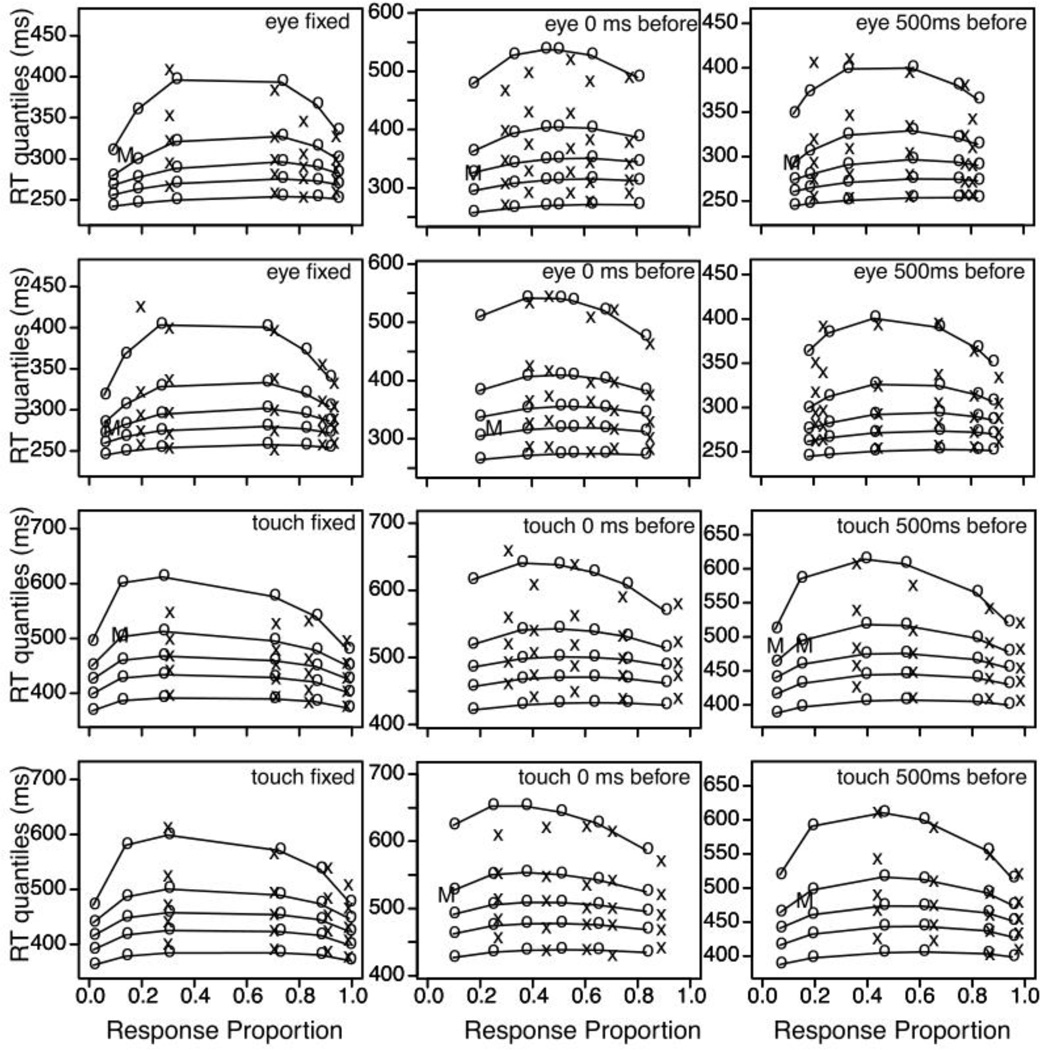
Accumulation of evidence models of perceptual decision making have been able to account for data from a wide range of domains at an impressive level of precision. In particular, Ratcliff's (1978) diffusion model has been used across many different 2-choice tasks in which the response is executed via a key-press. In this article, we present 2 experiments in which we used a letter-discrimination task exploring 3 central aspects of a 2-choice task: the discriminability of the stimulus, the modality of the response execution (eye movement, key pressing, and pointing on a touchscreen), and the mapping of the response areas for the eye movement and the touchscreen conditions (consistent vs. inconsistent). We fitted the diffusion model to the data from these experiments and examined the behavior of the model's parameters. Fits of the model were consistent with the hypothesis that the same decision mechanism is used in the task with 3 different response methods. Drift rates are affected by the duration of the presentation of the stimulus while the response execution time changed as a function of the response modality.


Figures

Figure 1
Figure 1
The figure shows a representation of the diffusion model. The top panel represents simulated paths with drift rate v, boundary separation a, and starting point z. The bottom panel represents the three components of a response time: Encoding time (u), decision time (d), and response output (w) time. The non-decision component is the sum of u and w with mean = Ter and with variability represented by a uniform distribution with range st.
Figure 2
Figure 2
The figure shows a representation of the display used in Experiment 2. In this example the target was a G, and the response areas were set to the 5th and 10th locations. The gray numbers in the figure are included to show the twelve possible locations of the response areas.
Figure 3
Figure 3
The different panels show the data and model fits for Experiment 1. The left hand columns show the responses for the alternative to the left for the three response modalities, and the right hand column shows the responses for the alternative to right. Within each panel, the columns of x’s and o’s are the empirical and the predicted responses to the different levels of stimulus presentation. Note that if there are too few responses in a condition to estimate the RT distributions we only display the median for the empirical values; an “M” is placed at the median when all subjects had at least one response, no symbol is showed when one or more subjects had no responses. There are six columns of data points within a panel (e.g., left side key press) because for each response there are six possible stimuli: (from left to right, i.e., from lower response proportion to higher response proportion: error responses for 40ms 20ms and 10ms stimulus duration, and correct responses for 10ms, 20ms, and 40ms stimulus duration.
Figure 4
Figure 4
The different panels show the data and model fits for Experiment 2 for the different response modalities (top two rows for eye movements: within these pair of rows one for responses to the left of the stimulus, the other for responses to the right); bottom two rows for touchscreen), and for the three different conditions for the display of the response configuration (left columns for fixed location, middle column for random location shown at the same time as the stimulus, and right column for random location shown 500 ms before the stimulus presentation).

Similar articles

Cited by

References

    1. Brown S, Heathcote A. A ballistic model of choice response time. Psychological Review. 2005;112:117–128. - PubMed
    1. Busemeyer JR, Townsend JT. Decision field theory: A dynamic-cognitive approach to decision making in an uncertain environment. Psychological Review. 1993;100:432–459. - PubMed
    1. Diederich A, Busemeyer J. Simple matrix methods for analyzing diffusion models of choice probability, choice response time, and simple response time. Journal of Mathematical Psychology. 2003;47(3):304–322.
    1. Gold J, Shadlen M. Neural computations that underlie decisions about sensory stimuli. Trends in Cognitive Sciences. 2001;5(1):10–16. - PubMed
    1. Gomez P, Ratcliff R, Perea M. Diffusion model of the go/no-go task. Journal of Experimental Psychology: General. 2007;136:389–413. - PMC - PubMed

Publication types