. 2015 Oct;29(10):1486-97.
doi: 10.1210/me.2015-1128. Epub 2015 Aug 31.

Compound A Inhibits Bladder Cancer Growth Predominantly via Glucocorticoid Receptor Transrepression

Affiliations

Compound A Inhibits Bladder Cancer Growth Predominantly via Glucocorticoid Receptor Transrepression

Yichun Zheng et al. Mol Endocrinol. 2015 Oct.

Abstract

Recent evidence indicates that glucocorticoids (GCs) suppress bladder cancer cell invasion through the GC receptor (GR) pathway, whereas androgen-mediated androgen receptor (AR) signals induce bladder tumor progression. In this study, we assessed the effects of 2-(4-acetoxyphenyl)-2-chloro-N-methyl-ethylammonium chloride (compound A [CpdA]), which was shown to function as not only a GR modulator but also an AR antagonist, on the growth of bladder cancer. In GR/AR-positive cells, CpdA strongly inhibited cell proliferation and colony formation as well as increased G1 phase-arrested cell population and apoptosis. Specifically, CpdA at 1μM decreased cell viability of TCCSUP/UMUC3-control-short hairpin RNA (shRNA), TCCSUP/UMUC3-GR-shRNA, and TCCSUP/UMUC3-AR-shRNA by 50%/67%, 25%/26%, and 38%/58%, respectively. CpdA also inhibited cell migration and invasion of GR/AR-positive (up to 61% decrease) and GR-positive/AR-silencing (up to 51% decrease) lines and, less strongly, those of GR-silencing/AR-positive lines (up to 35% decrease). Additionally, in UMUC3-control xenograft-bearing male mice, CpdA more strongly suppressed tumor growth than dexamethasone or hydroxyflutamide. In reporter gene assays, CpdA failed to induce GR transactivation, whereas it antagonized dihydrotestosterone-enhanced AR transactivation. In contrast, CpdA reduced nuclear factor (NF)-κB and activator protein 1 transcriptional activities, indicating induction of GR-mediated transrepression. Correspondingly, the expression of NF-κB-related molecules, matrix metalloproteinase-2, matrix metalloproteinase-9, interleukin-6, and vascular endothelial growth factor, was significantly down-regulated by CpdA in control lines but not in GR-silencing cells. Moreover, coimmunoprecipitation showed that CpdA promoted the interactions between GR and NF-κB. Thus, CpdA likely inhibits bladder cancer growth predominantly via inducing GR transrepression and at least partially mediated through the AR pathway, suggesting its effects more beneficial than GCs/pure GR ligands or AR antagonists.


Figures
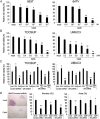
Figure 1.
Figure 1.. Effects of CpdA on cell proliferation.
MTT assay in 5637/647V cell lines cultured with ethanol (mock) or increasing concentrations of CpdA (1nM to 10μM) for 96 hours (A), TCCSUP/UMUC3 cell lines cultured with ethanol (mock) or increasing concentrations of CpdA (0.2μM to 10μM) for 96 hours (B), and TCCSUP/UMUC3-control/GR/AR-shRNA cell lines cultured with ethanol (mock), DEX (100nM), CpdA (1μM), and/or RU486 (RU) (10μM) for 96 hours (C). Growth suppression is presented relative to that of mock treatment in each cell line. D, Clonogenic assay in UMUC3-control/GR/AR-shRNA cell lines cultured with ethanol (mock) or CpdA (1μM) for 2 weeks. The number of colonies and their areas were quantitated, using the ImageJ software, and are presented relative to that of mock treatment. Each value represents the mean + SD from at least 3 independent experiments. *, P < .05 (vs mock treatment in each cell line); **, P < .01 (vs mock treatment in each cell line).
Figure 2.
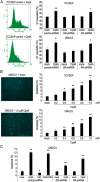
Figure 2.. Effects of CpdA on cell cycle and apoptosis.
A, Flow cytometry in TCCSUP/UMUC3-control/GR/AR-shRNA cell lines cultured with ethanol (mock) or CpdA (1μM) for 24 hours. Representative analyses and the percentages of cells in G1 phase are shown. TUNEL assay in TCCSUP/UMUC3 cell lines cultured with ethanol (mock) or increasing concentrations of CpdA (0.1μM to 1μM) for 48 hours (B) and UMUC3-control/GR/AR-shRNA cell lines cultured with ethanol (mock), CpdA (1μM), and/or DEX (100nM) for 48 hours (C). The percentages of TUNEL-positive cells were counted under a fluorescence microscopy. Each value represents the mean + SD from at least 3 independent experiments. *, P < .05 (vs mock treatment in parental or each control-shRNA cell line); **, P < .01 (vs mock treatment in parental or each control-shRNA cell line).
Figure 3.
Figure 3.. Effects of CpdA on cell migration and invasion.
Wound healing assay in TCCSUP/UMUC3-control/GR/AR-shRNA cell lines (A). The cells grown to confluence were gently scratched, and the wound area was measured after a 24-hour culture with ethanol (mock) or CpdA (1μM). The migration determined by the rate of cells filling the wound area is presented relative to that of mock treatment in each control-shRNA cell line. Transwell invasion assay in UMUC3-control/GR/AR-shRNA cell lines (B). The cells were cultured in the Matrigel-coated transwell chamber for 36 hours in the presence of ethanol (mock) or CpdA (1μM). The number of invaded cells present in the lower chamber was counted under a light microscope (×100 objective in 5 random fields). Cell invasion is presented relative to that of mock treatment in control-shRNA cell line. Each value represents the mean + SD from 3 independent experiments. *, P < .05 (mock vs CpdA treatment in each cell line); **, P < .01 (mock vs CpdA treatment in each cell line); #, P < .05 (vs mock treatment in control-shRNA cell line).
Figure 4.
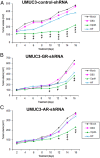
Figure 4.. Effects of CpdA on tumor growth in mouse xenograft models for bladder cancer.
CpdA, DEX, HF, or vehicle control was injected sc at peritumor sites in UMUC3-control-shRNA (A), UMUC3-GR-shRNA (B), or UMUC3-AR-shRNA (C) bearing NOD-SICD male mice (n = 5 per each condition). Tumor size was monitored every other days. Each value represents the mean of estimated tumor volume. *, P < .05 (mock vs CpdA); #, P < .05 (DEX vs CpdA); +, P < .05 (HF vs CpdA).
Figure 5.
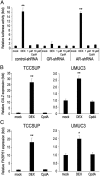
Figure 5.. Effects of CpdA on GR transactivation.
A, UMUC3-control/GR/AR-shRNA cell lines were cotransfected with MMTV-Luc and pRL-TK and subsequently cultured with ethanol (mock), DEX (100nM), or CpdA (1μM or 10μM) for 24 hours. Luc activity is presented relative to that with mock treatment in each cell line. TCCSUP/UMUC3 cell lines cultured with ethanol (mock), DEX (100nM), or CpdA (1μM) for 24 hours were subjected to RNA extraction and subsequent real-time RT-PCR for GILZ (B) and FKBP51 (C). Expression of each specific gene was normalized to that of GAPDH. Transcription amount is presented relative to that of mock treatment in each cell line. Each value represents the mean + SD from at least 3 independent experiments. *, P < .05 (vs mock treatment in each cell line); **, P < .01 (vs mock treatment in each cell line).
Figure 6.
Figure 6.. Effects of CpdA on GR transrepression.
UMUC3 cells were cotransfected with NF-κB-Luc (A)/AP-1-Luc (B) and pRL-TK and subsequently cultured with ethanol (mock), DEX (100nM), or CpdA (1μM or 10μM) for 24 hours. Luc activity is presented relative to that with mock treatment. TCCSUP (C) and UMUC3-control/GR/AR-shRNA (D) cell lines cultured with ethanol (mock) or CpdA (1μM) for 24 hours were subjected to RNA extraction and subsequent real-time RT-PCR for MMP-2, MMP-9, IL-6, and VEGF. Expression of each specific gene was normalized to that of GAPDH and β-actin. Transcription amount is presented relative to that of mock treatment in TCCSUP or UMUC3-control-shRNA. Each value represents the mean + SD from at least 3 independent experiments. *, P < .05 (vs mock treatment in each cell line); **, P < .01 (vs mock treatment in each cell line).
Figure 7.
Figure 7.. CpdA-induced interaction between NF-κB and GR.
A, Cell lysates from UMUC3/TCCSUP cultured with ethanol (mock), 1μM CpdA, or 100nM DEX for 24 hours were immunoprecipitated with an anti-NF-κB antibody or IgG and then immunoblotted for GR. B, TCCSUP/UMUC3 cell lines cultured with ethanol (mock), 1μM CpdA, or 10nM DEX for 24 hours were analyzed on Western blotting, using an antibody to GR (95 kDa) or NF-κB (65 kDa). GAPDH (37 kDa) served as an internal control.
Figure 8.
Figure 8.. Effects of CpdA on AR.
A, UMUC3-GR-shRNA cells were cotransfected with MMTV-Luc and pRL-TK and subsequently cultured with ethanol (mock), DHT (1nM), CpdA (1μM), and/or HF (5μM) for 24 hours. Luc activity is presented relative to that with mock treatment. Each value represents the mean + SD from at least 3 independent experiments. *, P < .05 (vs mock treatment); #, P < .05 (vs DHT treatment). B, Nuclear protein fractions from UMUC3 cells cultured with ethanol (mock), 1nM DHT, and/or 1μM CpdA for 24 hours were analyzed on Western blotting, using an antibody to AR (110 kDa). Histone 3 (15 kDa) served as an internal control.

Similar articles

Cited by

References

    1. Miyamoto H, Zheng Y, Izumi K. Nuclear hormone receptor signals as new therapeutic targets for urothelial carcinoma. Curr Cancer Drug Tar. 2012;12:14–22. - PubMed
    1. Zheng Y, Izumi K, Li Y, Ishiguro H, Miyamoto H. Contrary regulation of bladder cancer cell proliferation and invasion by dexamethasone-mediated glucocorticoid receptor signals. Mol Cancer Ther. 2012;11:2621–2632. - PubMed
    1. Ishiguro H, Kawahara T, Zheng Y, Netto GJ, Miyamoto H. Reduced glucocorticoid receptor expression predicts bladder tumor recurrence and progression. Am J Clin Pathol. 2014;142:157–164. - PMC - PubMed
    1. Zhang C, Wenger T, Mattern J, et al. . Clinical and mechanistic aspects of glucocorticoid-induced chemotherapy resistance in the majority of solid tumors. Cancer Biol Ther. 2007;6:278–287. - PubMed
    1. Ishiguro H, Kawahara T, Zheng Y, Kashiwagi E, Li Y, Miyamoto H. Differential regulation of bladder cancer growth by various glucocorticoids: corticosterone and prednisone inhibit cell invasion without promoting cell proliferation or reducing cisplatin cytotoxicity. Cancer Chemother Pharmacol. 2014;74:249–255. - PubMed

Publication types

MeSH terms