. 2015 Oct;12(10):975-81.
doi: 10.1038/nmeth.3553. Epub 2015 Aug 31.

Programmed synthesis of three-dimensional tissues

Affiliations

Programmed synthesis of three-dimensional tissues

Michael E Todhunter et al. Nat Methods. 2015 Oct.

Abstract

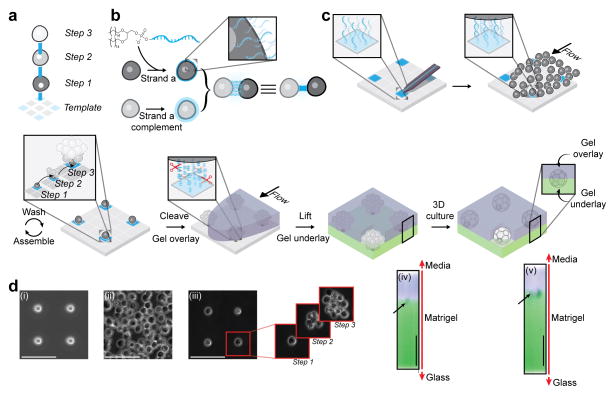
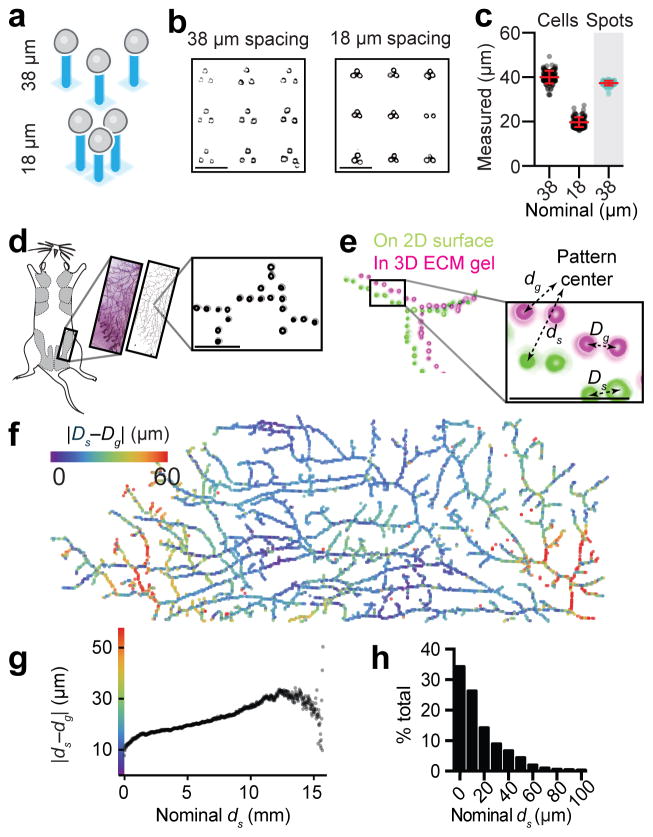
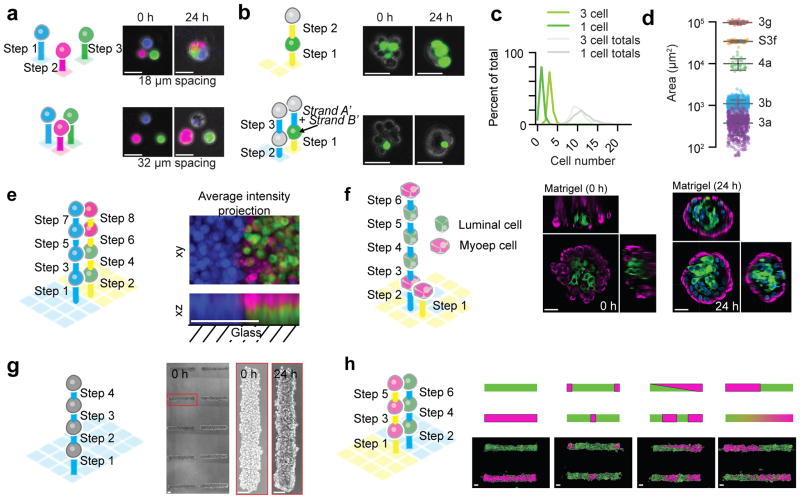
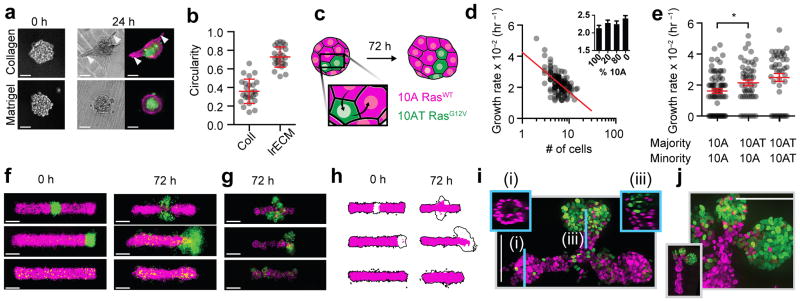
Reconstituting tissues from their cellular building blocks facilitates the modeling of morphogenesis, homeostasis and disease in vitro. Here we describe DNA-programmed assembly of cells (DPAC), a method to reconstitute the multicellular organization of organoid-like tissues having programmed size, shape, composition and spatial heterogeneity. DPAC uses dissociated cells that are chemically functionalized with degradable oligonucleotide 'Velcro', allowing rapid, specific and reversible cell adhesion to other surfaces coated with complementary DNA sequences. DNA-patterned substrates function as removable and adhesive templates, and layer-by-layer DNA-programmed assembly builds arrays of tissues into the third dimension above the template. DNase releases completed arrays of organoid-like microtissues from the template concomitant with full embedding in a variety of extracellular matrix (ECM) gels. DPAC positions subpopulations of cells with single-cell spatial resolution and generates cultures several centimeters long. We used DPAC to explore the impact of ECM composition, heterotypic cell-cell interactions and patterns of signaling heterogeneity on collective cell behaviors.


Figures

Figure 1
Figure 1. Programming the reconstitution of fully ECM-embedded 3D microtissues by DNA-programmed assembly (DPAC)
(a) Scheme showing the relationship between DNA spots (colored squares), DNA-programmed connectivity (colored lines), and multistep assembly. (b) Incubation of cells with lipid-modified oligonucleotides results in chemical remodeling of cell surfaces. Combining cells bearing complementary cell-surface oligonucleotides forms a temporary chemical adhesion. (c) 7 μm amino-modified DNA spots are patterned onto aldehyde-coated glass slides and covalently linked to the surface by reductive amination. Cells bearing complementary cell-surface oligonucleotides are introduced above the patterned substrate at high concentration and at controlled flow rate using a flow cell. Cells adhere to the appropriate DNA spot, and excess cells are removed by gentle washing. Iteration of this process assembles the microtissue into the third dimension. Addition of liquid ECM incorporating DNase releases the assembled microtissues from the template where they are trapped in the embedding ECM as it gels. The gel is peeled off the glass, releasing the tissues. Underlay of the gel with additional ECM results in a fully embedded 3D culture. Cells interact with each other and their microenvironment as they condense into 3D microtissues. (d) Implementation of the scheme described in Figure 1a–c using MCF10A mammary epithelial cells showing (i) DNA spots, (ii) cells in flow cell, and (iii) single cell array followed by additional rounds of programmed assembly. X,Z reconstructions show an unstained MCF10A cell aggregate embedded between Alexa Fluor-488 and Alexa Fluor 555-stained layers of Matrigel at (iv) 0 and (v) 24 hr. All scale bars are 100 μm.
Figure 2
Figure 2. Cell position is preserved upon transfer of cell patterns from their template to ECM for fully embedded 3D culture
(a) Scheme and (b) Matrigel-embedded cell triangles having a nominal cell-to-cell spacing of 18 and 38 microns, respectively. (c) Observed cell-to-cell spacing (mean ± s.d.) compared to the spacing of printed DNA spots (grey background) (n=200). (d) A whole mount image of a mouse mammary fat pad (reproduced with permission of Dr. William Muller) was digitized, used to print a pattern of DNA spots, and rendered as a 1.6 cm-long pattern of single cells fully embedded in Matrigel. (e) Globally aligned and superimposed images of the cell pattern while still attached to the glass template (green) and fully embedded in Matrigel (magenta). Global and relative differences in cell positioning were calculated using the indicated metrics. (f) Heat map illustrating differences in global cell position in 2D vs. 3D relative to the pattern center. (g) Graph generated from over 36 million cell pairs relating the difference from expected cell-to-cell distances for the pattern in (d). (h) Histogram showing deviations from expected cell-to-cell distances for all cell pairs patterned within 50 μm of one another. All scale bars are 100 μm.
Figure 3
Figure 3. Reconstituting epithelial microtissues with programmed size, shape, composition, spatial heterogeneity, and embedding ECM
(a) Scheme and images of magenta, green, and blue-stained MCF10A cells patterned with 18 and 38 μm spacing and fully embedded in Matrigel. (b) Scheme and images for Matrigel-embedded MCF10A microtissues programmed with two distinct compositions (one or three green cells) but similar average sizes. (c) Quantification of microtissue composition for data in (b). (d) Distribution of cross-sectional areas (mean ± s.d.) for microtissues assembled through each of five synthetic schemes (Supplementary Table) (for 3a, n=507. for 3b, n=640. for 4a, n=25. for S3f, n=40. for 3g, n=25.). Note that purple features (3a) come from single cell arrays, included to indicate the fundamental heterogeneity in the sizes of the cellular building blocks. (e) Scheme and average intensity projections for a multicellular assembly having three mutually perpendicular cell compartments. (f) Scheme and images of fully embedded aggregates of human luminal and myoepithelial cells. (g) Four-step synthetic scheme and images of MCF10A cells assembled into cylindrical microtissues and transferred to Matrigel/collagen mixtures. (h) Scheme, diagram, and images of cylindrical microtissues having defined patterns of spatial heterogeneity. Scale bars are 30 μm in (a), (b), and (f). Scale bars are 100 μm in (e), (g), and (h).
Figure 4
Figure 4. Measuring the impact of microtissue size, shape, composition, spatial heterogeneity, and embedding ECM on collective cell behaviors
(a) Representative images of human mammary luminal and myoepithelial cells assembled through identical four-step synthetic schemes and then transferred to Matrigel or collagen-1. (b) Quantification (mean ± s.d.) of microtissue morphology for the experiment in (a) (n=25 for both conditions). (c) Scheme for assessing the impact of composition on the growth rate of 10A and H-RasG12V-expressing 10ATs. (d) The effect of initial microtissue size on cell growth rate for 10As (n=123). Inset shows growth rate (mean ± s.d.) for microtissues having different compositions. (e) Growth rates (mean ± s.d.) of single cells (minority) cultured in microtissues having the indicated majority cell-type (n=71, 49, 42). (f) Superimposed average intensity projections of 12–14 single confocal sections of 10As (magenta = H2B-mCherry) and 10ATs (green = H2B-eGFP) in Matrigel/collagen mixtures. (g) Representative epifluorescent microscopy images of microtissue after 72 hr culture. (h) 90% intensity contours of the collection of microtissues from (f). Black outline is the contour of the entire microtissue, and the magenta region is specifically the 10A component. (i) Maximum intensity projection of a center-patterned microtissue after processing using CLARITY. Insets are single confocal sections of the indicated region of the microtissue. (j) Maximum intensity projection showing detail from the branching region of an end-patterned tissue (inset) after processing using CLARITY. All scale bars are 100 μm.
Figure 5
Figure 5. DPAC control of stromal architecture
(a) HUVEC cells assembled (scheme in Fig. 3h) into a 6.2 mm (corner-to-corner) network fully embedded in a Matrigel/collagen mixture. Detail shows the pattern immediately after transfer to gel and the same region after 24 hr culture. (b, top) Localization of VE-cadherin (green) at cell-cell interfaces and exclusion from cell-ECM interfaces (white arrowhead) in HUVEC networks, and (b, bottom) HUVEC networks incorporating peripheral pericytes (HBVP, magenta). (c) Morphology of HUVEC networks assembled with the indicated accessory cell type and cultured for 24 hr in a Matrigel/collagen mixture. (d) Quantification of branch length (mean ± s.d.) (n=7,9,9,5), and (e) branch density (mean ± s.d.) (n=36,59,36) in HUVEC networks incorporating the indicated accessory cell type. (f) Scheme for the assembly of a three-component microtissue incorporating epithelial and stromal cell types. (g) 3D tissue culture and detail of patterns containing perpendicularly oriented HUVEC networks and fibroblasts. (h) Analytical scheme and quantification (mean ± s.d.) of HUVEC extension in microtissues with HUVEC and fibroblast components (n=110). In (g) scale bars are 500 μm. All other scale bars are 100 μm.

References

    1. Sasai Y. Cytosystems dynamics in self-organization of tissue architecture. Nature. 2013;493:318–326. - PubMed
    1. Nelson C, Bissell M. Of extracellular matrix, scaffolds, and signaling: tissue architecture regulates development, homeostasis, and cancer. Annu Rev Cell Dev Biol. 2006;22:287–309. - PMC - PubMed
    1. Bissell MJ, Rizki A, Mian IS. Tissue architecture: the ultimate regulator of breast epithelial function. Current opinion in cell biology. 2003;15:753–762. - PMC - PubMed
    1. Schmeichel KL, Bissell MJ. Modeling tissue-specific signaling and organ function in three dimensions. J Cell Sci. 2003;116:2377–2388. - PMC - PubMed
    1. Lancaster MA, Knoblich JA. Organogenesis in a dish: modeling development and disease using organoid technologies. Science. 2014;345:1247125–1247125. - PubMed

Publication types