. 2015 Aug 31;10(8):e0137223.
doi: 10.1371/journal.pone.0137223. eCollection 2015.

Microarray Analysis of Copy Number Variants on the Human Y Chromosome Reveals Novel and Frequent Duplications Overrepresented in Specific Haplogroups

Affiliations

Microarray Analysis of Copy Number Variants on the Human Y Chromosome Reveals Novel and Frequent Duplications Overrepresented in Specific Haplogroups

Martin M Johansson et al. PLoS One. .

Abstract

Background: The human Y chromosome is almost always excluded from genome-wide investigations of copy number variants (CNVs) due to its highly repetitive structure. This chromosome should not be forgotten, not only for its well-known relevance in male fertility, but also for its involvement in clinical phenotypes such as cancers, heart failure and sex specific effects on brain and behaviour.

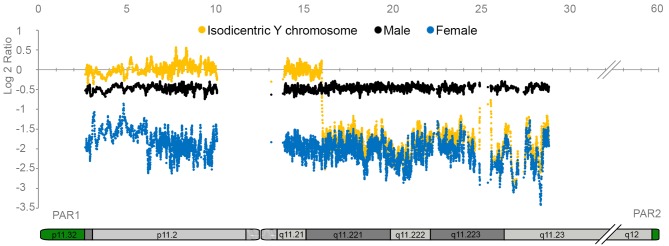
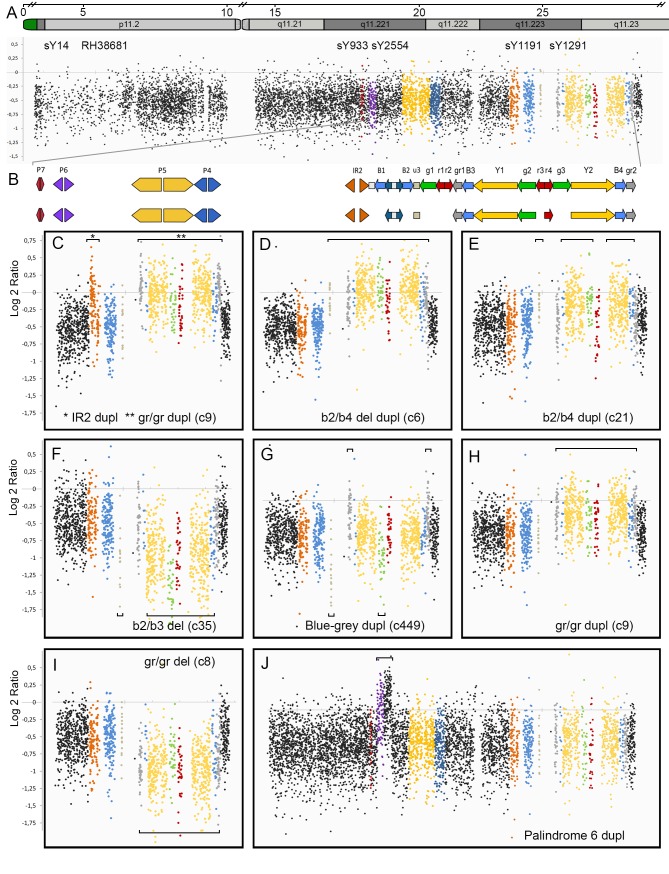
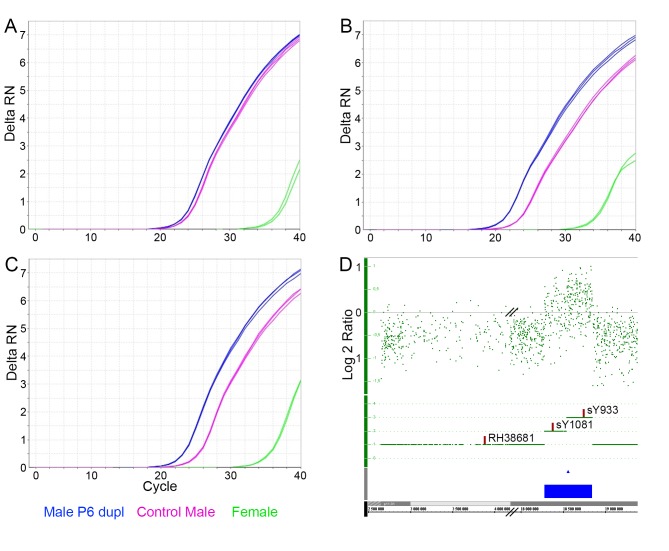
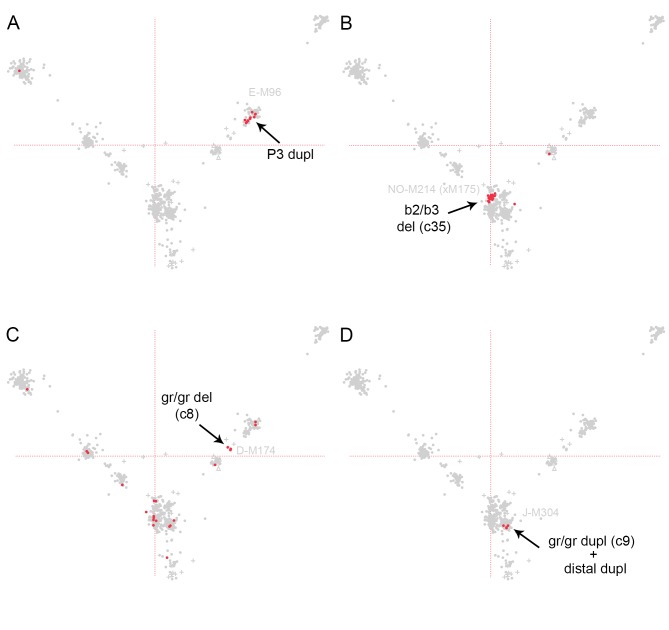
Results: We analysed Y chromosome data from Affymetrix 6.0 SNP arrays and found that the signal intensities for most of 8179 SNP/CN probes in the male specific region (MSY) discriminated between a male, background signals in a female and an isodicentric male containing a large deletion of the q-arm and a duplication of the p-arm of the Y chromosome. Therefore, this SNP/CN platform is suitable for identification of gain and loss of Y chromosome sequences. In a set of 1718 males, we found 25 different CNV patterns, many of which are novel. We confirmed some of these variants by PCR or qPCR. The total frequency of individuals with CNVs was 14.7%, including 9.5% with duplications, 4.5% with deletions and 0.7% exhibiting both. Hence, a novel observation is that the frequency of duplications was more than twice the frequency of deletions. Another striking result was that 10 of the 25 detected variants were significantly overrepresented in one or more haplogroups, demonstrating the importance to control for haplogroups in genome-wide investigations to avoid stratification. NO-M214(xM175) individuals presented the highest percentage (95%) of CNVs. If they were not counted, 12.4% of the rest included CNVs, and the difference between duplications (8.9%) and deletions (2.8%) was even larger.

Conclusions: Our results demonstrate that currently available genome-wide SNP platforms can be used to identify duplications and deletions in the human Y chromosome. Future association studies of the full spectrum of Y chromosome variants will demonstrate the potential involvement of gain or loss of Y chromosome sequence in different human phenotypes.


Conflict of interest statement

Competing Interests: The authors have declared that no competing interests exist.

Figures

Fig 1
Fig 1. Comparison of Y chromosome SNP/CN probe intensities between a male, a female and a male with an isodicentric Y chromosome.
The Y axis denotes the log ratio of the average signal intensities for each 20 consecutive SNP/CN probes, while the X axis denotes the genomic position on the Y chromosome, in million base pairs. The signals for a control male are represented in black, female signals are in blue and the signals for the male with an isodicentric Y chromosome are in yellow. Only probes corresponding to the male specific Y region are included.
Fig 2
Fig 2. Y chromosome CNV discovery in a Norwegian population.
A. Signal intensity plot (Log 2 ratio) for a control male without CNV variants. Signals from each of the 8179 probes are represented by one dot. B. Regions of the Y chromosome containing ampliconic and palindromic sequences are represented by colored arrows using the same nomenclature as in Repping et al. [41]. The same colors were used to represent the signal intensity of the corresponding regions in the rest of the figure. Not all ampliconic sequences are covered by SNP/CN probes in the array. The lower part of Fig 2B includes only detectable regions. C to I. Signal intensity plots (Log 2 ratio) for different type of CNVs discovered in a Norwegian population. The lower part of each subfigure shows the name of each CNV following the nomenclature used in Repping et al. [41]. Staples delineate the positions of duplications (on the top of the figure) or deletions (on the bottom). J. Signal intensity plot for a previously undescribed duplication hereby named P6 dupl.
Fig 3
Fig 3. qPCR validation of the newly discovered P6 duplication.
Amplification plots for a female (green), a control male (purple) and a male with P6 dupl. (blue) are shown for markers RH38681 (A), sY1081 (B) and sY933 (C). D. Intensity signal plot (Log 2 ratio) for an individual with P6 dupl. showing that markers sY1081 and sY933 are positioned within the duplicated region, while RH38681 is located outside.
Fig 4
Fig 4. Principal component analysis of Y chromosome specific SNP variation between haplogroups.
A. The figure shows the graphical representation of the first two eigenvectors after PCA analysis. Y-axis corresponds to the first vector explaining 24.1% of the variation and X-axis explains 13.4% of the remaining variation. Each dot represents the results from one individual and the colour represent each HG as denoted by letters in the figure. The plus symbols in black denote individuals for which HG determination was ambiguous. The black triangles denote individuals for which no HG could be assigned. B. The results from the individuals carrying the blue-grey dupl are represented in blue, while the results from individuals carrying “blue-grey like dupl.” are in red. All cases are included within the NO-M214(xM175) haplogroup. In total 11 individuals carry these variants (Table 1) but they are superimposed in the figure, due to high similarity between their HG.
Fig 5
Fig 5. Distribution of CNV patterns that were significantly overrepresented in one haplogroup only.
Each part of the figure shows the graphical representation of the first two eigenvectors after PCA analysis A. The figure shows PCA values for individuals with P3 dupl. significantly overrepresented in haplogroup E-M96. B. Individuals with b2/b3 del. significantly overrepresented in haplogroup NO-M214(xM175). C. Individuals with gr/gr del. (c8) significantly overrepresented in haplogroup D-M174. This CNV is also present in other haplogroups. D. Individuals with gr/gr dupl. (c9) + distal dupl. significantly overrepresented in haplogroup J-P256.

Similar articles

Cited by

References

    1. Riggs ER, Ledbetter DH, Martin CL. Genomic Variation: Lessons Learned from Whole-Genome CNV Analysis. Current genetic medicine reports. 2014;2:146–50. 10.1007/s40142-014-0048-4 - DOI - PMC - PubMed
    1. Aston KI. Genetic susceptibility to male infertility: news from genome-wide association studies. Andrology. 2014;2(3):315–21. Epub 2014/02/28. 10.1111/j.2047-2927.2014.00188.x . - DOI - PubMed
    1. Lu C, Zhang F, Yang H, Xu M, Du G, Wu W, et al. Additional genomic duplications in AZFc underlie the b2/b3 deletion-associated risk of spermatogenic impairment in Han Chinese population. Human molecular genetics. 2011;20(22):4411–21. 10.1093/hmg/ddr369 . - DOI - PubMed
    1. Forsberg LA, Rasi C, Malmqvist N, Davies H, Pasupulati S, Pakalapati G, et al. Mosaic loss of chromosome Y in peripheral blood is associated with shorter survival and higher risk of cancer. Nature genetics. 2014;46(6):624–8. 10.1038/ng.2966 . - DOI - PMC - PubMed
    1. Dumanski JP, Rasi C, Lonn M, Davies H, Ingelsson M, Giedraitis V, et al. Mutagenesis. Smoking is associated with mosaic loss of chromosome Y. Science. 2015;347(6217):81–3. 10.1126/science.1262092 . - DOI - PMC - PubMed

Publication types

LinkOut - more resources