. 2015 Oct;18(10):1446-54.
doi: 10.1038/nn.4104. Epub 2015 Aug 31.

Molecular profiling of activated olfactory neurons identifies odorant receptors for odors in vivo

Affiliations

Molecular profiling of activated olfactory neurons identifies odorant receptors for odors in vivo

Yue Jiang et al. Nat Neurosci. 2015 Oct.

Abstract

The mammalian olfactory system uses a large family of odorant receptors (ORs) to detect and discriminate amongst a myriad of volatile odor molecules. Understanding odor coding requires comprehensive mapping between ORs and corresponding odors. We developed a means of high-throughput in vivo identification of OR repertoires responding to odorants using phosphorylated ribosome immunoprecipitation of mRNA from olfactory epithelium of odor-stimulated mice followed by RNA-Seq. This approach screened the endogenously expressed ORs against an odor in one set of experiments using awake and freely behaving mice. In combination with validations in a heterologous system, we identified sets of ORs for two odorants, acetophenone and 2,5-dihydro-2,4,5-trimethylthiazoline (TMT), encompassing 69 OR-odorant pairs. We also identified shared amino acid residues specific to the acetophenone or TMT receptors and developed models to predict receptor activation by acetophenone. Our results provide a method for understanding the combinatorial coding of odors in vivo.


Figures

Figure 1
Figure 1
Odor stimulation induces S6 phosphorylation in the mouse OE. (a) Coronal section of OE stimulated with 100% acetophenone (upper) and no odor (control) condition for 1 hour. Green: Antibody staining for pS6. Magenta: Antibody staining for a known acetophenone receptor, M72. Blue: Bisbenzimide staining showing the nuclei. Arrowheads indicate colocalization of M72 and pS6 signals. Scale bar, 25 μm. (b) Quantification of pS6 induction in M72–expressing OSNs following odor stimulation by M72 agonists (methyl salicylate, methyl benzoate, acetophenone) and controls [no odor, heptanoic acid, TMT, (+)–carvone]. (c) Coronal section of OE stimulated with 100% acetophenone for 1 hour. Green: Antibody staining for pS6. Magenta: RNA FISH for 5 ORs, respectively. Blue: Bisbenzimide staining showing the nuclei. Arrowheads indicate colocalization of M72 and pS6 signals. Scale bar, 25 μm. (d) Quantification of pS6 staining intensity for 5 known OR–odorant pairs. (e) Quantification of pS6 staining intensity following 1% and 100% odorant stimulation for 5 known OR–odorant pairs.
Figure 2
Figure 2
pS6–IP enriches OR mRNAs from odor stimulated OE. (a) Scheme of the experiment. When the animal is exposed to odor, ribosome subunit S6 undergoes phosphorylation in odor–responding OSNs. pS6–IP enriches for mRNA species expressed in the activated OSNs, which can be then profiled by RNA–Seq. (b) Scatter plot comparing immunoprecipitated mRNA counts from stimulated sample (100% acetophenone) versus unstimulated sample. X–axis: Mean read counts of genes in unstimulated IP samples (n = 3). Y–axis: Mean read counts of genes in acetophenone stimulated IP samples (n = 3). Red dots represent ORs. Gray dots represent non–OR genes. Broken line: unit–slope. (c) Differential enrichment calling of OR mRNA. 75 ORs are enriched in the 100% acetophenone stimulated group with p–value smaller than 0.05, after adjusting for multiple comparisons across the detected OR repertoire. Broken line: unit–slope. (d) Volcano plot showing enrichment of OR mRNA in 100% acetophenone stimulated group. (e) Differential enrichment calling of OR mRNA. 25 ORs are enriched in the 1% acetophenone stimulated group with p–value smaller than 0.05, after adjusting for multiple comparisons across the detected OR repertoire. Broken line: unit–slope. (f) Volcano plot showing enrichment of OR mRNA in 1% acetophenone stimulated group. (g) Scatter plot comparing p–values of enrichment in 100% acetophenone versus 1% acetophenone stimulated samples. Red dashed line: p = 0.001. Blue dashed line: p = 0.05. Note the absence of ORs in the bottom right corner.
Figure 3
Figure 3
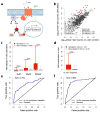
Correlation between in vivo and in vitro responses. (a) The heterologous OR signaling pathway. AC, adenylyl cyclase; CRE, cAMP response element; CREB, cAMP response element–binding protein; PKA, protein kinase A; RTP1S, receptor–transporting protein 1 (short). (b) ORs tested for in vitro responses to acetophenone. (c) In vitro activation of 71 enriched and 449 un–enriched ORs. Y–axis: normalized fold of increase in luciferase signals. 100% is determined by the fold of increase of Olfr1126 stimulated with 300 μM acetophenone. 0% is determined by the fold of increase of empty vector stimulated with 3 μM acetophenone. Red: ORs enriched at p < 0.05. Gray: ORs not called enriched at p = 0.05. Black bar: median; Box: 25 and 75 percentile; Whisker: 5 and 95 percentile. Wilcoxon rank sum test for difference of in vitro responses between enriched and not enriched: 3 μM p = 0.1, 30 μM p = 0.005, 300 μM p = 7 × 10–21. (d) In vivo enrichment of 107 activated and 413 not activated ORs. Y–axis: fold of enrichment of transcripts by pS6 IP. Red: ORs activated in vitro. Gray: ORs not activated in vitro. Black bar: median; Box: 25 and 75 percentile; Whisker: 5 and 95 percentile. Wilcoxon rank sum test for difference of in vivo enrichment between activated and not activated: p = 1 × 10–14. (e) ROC curves illustrating performance of classifiers using in vivo enrichment p–values to predict whether the OR responds to acetophenone in vitro. Area Under Curve: 0.754, p = 6 × 10–16, Wilcoxon rank–sum test (one tailed against H0: Classifier performance no better than random).. (f) ROC curves illustrating performance of classifiers using in vitro responses to predict whether the OR is enriched at p < 0.05. Area Under Curve: 0.845, p = 7 × 10–21, Wilcoxon rank–sum test (one tailed against H0: Classifier performance no better than random).
Figure 4
Figure 4
Identification of acetophenone receptors (a) Read counts of acetophenone receptors in control and 1% acetophenone stimulated samples (left, n = 3 pairs). Read counts of acetophenone receptors in control and 100% acetophenone stimulated samples (right, n = 3 pairs). (b) in vitro responses of the acetophenone receptors. Responses are scaled to Olfr160 (M72). The maximum response of Olfr160 is defined as 1. (c) Coronal section of OE following acetophenone stimulation for 1 hour. Green: Antibody staining for pS6. Magenta: RNA FISH for a newly identified acetophenone OR, Olfr19. Blue: Bisbenzimide staining showing the nuclei. Scale bar, 25 μm. (d) Quantification of pS6 induction in OSNs expressing several newly–identified acetophenone ORs expressed in the dorsal OE (Olfr19, Olfr923, Olfr1104, Olfr1444) and ventral OE (Olfr736 and Olfr1093), along with a control OR (Olfr1132) following 1% and 100% acetophenone stimulation.
Figure 5
Figure 5
Correlation between in vivo and in vitro sensitivities of ORs. (a) Correlation between EC50 values measured for acetophenone in vitro and fold change of RNA transcript abundance following 1% acetophenone stimulation in the pS6–IP experiment in vivo. p = 0.005, linear regression and ANOVA. Spearman’s rho=–0.395. (b) Correlation between EC50 values measured for acetophenone in vitro and fold change of RNA transcript abundance following 100% acetophenone stimulation in the pS6–IP experiment in vivo. p = 0.993, linear regression and ANOVA. Spearman’s rho=0.00137. (c) Fractions of ORs that are relatively more sensitive (log10EC50 ≤–4), moderately sensitive (log10EC50 between –2 and –4), and not sensitive (log10EC50 > –2), in the groups of ORs not enriched in pS6–IP, only enriched by 100% acetophenone, and enriched by 1% acetophenone. p < 2 × 10–16, Chi–square test. (d) Beanplot showing the distribution of log10EC50 values in ORs only enriched by 100% acetophenone as compared to those enriched by 1% acetophenone. p = 0.207, Wilcoxon rank–sum test.
Figure 6
Figure 6
Sequence–function analysis of the identified acetophenone receptors. (a) Distance tree of OR protein sequences. Red, ORs enriched by 1% acetophenone and confirmed in vitro. Orange, ORs additionally enriched by 100% acetophenone and confirmed in vitro. (b) Amino acid residues that are more conserved in the acetophenone receptors than random OR sets of the same size. Red, p < 0.01. Orange, p < 0.05. (c) Principle component analysis of amino acid properties of mouse ORs. Plot showing the first three principle components (variance explained: 6.8%, 3.7%, 2.6%). Cyan: acetophenone ORs. Magenta: ORs that do not respond to acetophenone both in vivo and in vitro. Gray: other ORs. (d) ROC curve illustrating cross–validation of SVM (magenta), elastic–net logistic regression (green) and overall sequence similarity based (black) models on mouse ORs. (e) ROC curve illustrating external validation of SVM (magenta), elastic–net logistic regression (green) and overall sequence similarity based (black) models using in vitro data of 27 human ORs.
Figure 7
Figure 7
Identification of ORs activated by TMT. (a) Volcano plot showing enrichment of OR mRNA in 100% TMT stimulated group (left) and 1% acetophenone stimulated group (right). (b) in vitro responses of the TMT receptors. (c) Distance tree of OR protein sequences comparing acetophenone and TMT ORs. Orange, ORs activated by acetophenone. Blue, ORs activated by TMT. Red, ORs activated by both acetophenone and TMT. (d) Amino acid residues that are conserved in the acetophenone receptors (orange, p < 0.05), TMT receptors (blue, p < 0.05), and both (red). The amino acid residues that are conserved in all ORs are labeled for comparison (90%, magenta circles).

Similar articles

Cited by

References

    1. Buck L, Axel R. A novel multigene family may encode odorant receptors: a molecular basis for odor recognition. Cell. 1991;65:175–187. - PubMed
    1. Niimura Y, Matsui A, Touhara K. Extreme expansion of the olfactory receptor gene repertoire in African elephants and evolutionary dynamics of orthologous gene groups in 13 placental mammals. Genome research. 2014;24:1485–1496. - PMC - PubMed
    1. Malnic B, Hirono J, Sato T, Buck LB. Combinatorial receptor codes for odors. Cell. 1999;96:713–723. - PubMed
    1. Saito H, Chi Q, Zhuang H, Matsunami H, Mainland JD. Odor coding by a mammalian receptor repertoire. Science signaling. 2009;2:ra9. - PMC - PubMed
    1. Peterlin Z, Firestein S, Rogers ME. The state of the art of odorant receptor deorphanization: A report from the orphanage. The Journal of general physiology. 2014;143:527–542. - PMC - PubMed

Publication types

Substances

Associated data