Figure 2
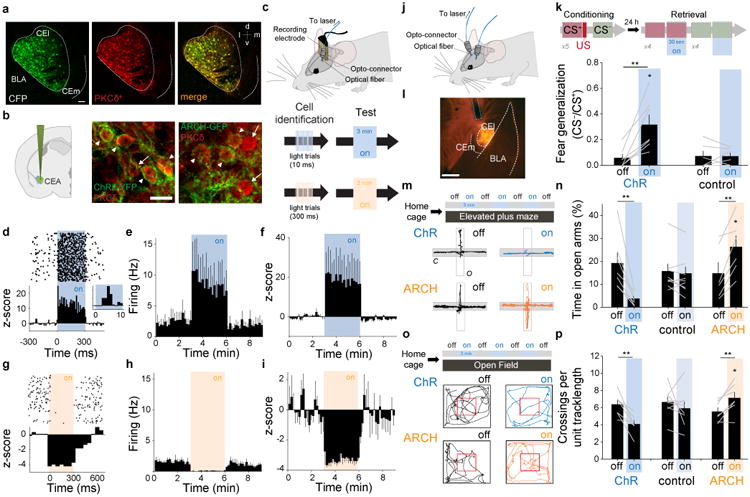
Bi-directional regulation of fear generalization and anxiety through optogenetic control of CEA PKCδ+ neurons. a, Stainings for Cyan Fluorescence Protein (CFP, green) and endogenous PKCδ(red) confirm overlap of CFP with endogenous PKCδ (98% CFP+ cells were PKCδ+; 100% PKCδ+ cells were CFP+). White dashed lines denote the contour of CEA (CEl and CEm). b, Left, Representative cartoon illustrating the injection of conditional AAVs expressing ChR2-YFP or ARCH-GFP into CEA. Middle, Overlap of endogenous PKCδ (red) and ChR2-YFP (green). Right, Overlap of endogenous PKCδ (red) and ARCH-GFP (green). Arrows indicate cells with overlap, red triangles point to cells stained only for PKCδ. Scale bar: 20 μm. c, Top, Experimental configuration illustrating in vivo optrode implants; Bottom, Light-responsive units were identified using 300 ms light pulses followed by 3 min continued test stimulations as used during behavioral experiments. d, Top, Raster plot illustrating firing of an identified ChR2-expressing PKCδ+ neuron before, during and after 300 ms blue light stimulation; Bottom, PSTH of the z-score shows a marked increase in firing during the 300 ms light pulse. Inset, z-score of the short-latency light-induced responses. e, Rate histogram average before, during and after 3 min light stimulation on identified ChR2-expressing PKCδ+ neurons (n = 5 cells/2 mice). f, z-score histogram illustrating increased firing of ChR2-expressing PKCδ+ neurons during 3 min light stimulation (n = 5 cells/2 mice). g, Top, Raster plot illustrating firing of an identified ARCH-expressing PKCδ+ neuron before, during and after 300 ms yellow light stimulation; Bottom, PSTH of the z-score shows a marked decrease in firing during the 300 ms light pulse. h, Rate histogram average before, during and after 3 min light stimulation on identified ARCH-expressing PKCδ+ neurons (n = 6 cells/3 mice). i, z-score histogram illustrating increased firing of ARCH-expressing PKCδ+ neurons during 3 min light stimulation (n = 6 cells/3 mice). All error bars indicate mean ± s.e.m. j, Schematic representation of a freely moving mouse bilaterally implanted with optical fibers after injection of DIO-AAVs expressing either ChR2 or ARCH. k, Coronal sections of a mouse brain indicating the location of CEA and the expression of a conditional rAAV expressing ChR2 and mCherry. White dashed lines indicate anatomical boundaries of BLA, CEl and CEm. The blue dashed line indicates the insertion of the optical fiber. Scale bar: 500 μm. l, Top, Schematic of the experimental paradigm. Bottom, Bar graph illustrating increased fear generalization upon stimulation with blue light in PKCδ-Cre animals infected with DIO-AAV-ChR2 (n = 7 mice), but not in control animals (n = 6 mice; Two way ANOVA: F(1,11) = 11.83, P= 0.005 for the interaction injection × light stimulation; post-hoc Sidak's multiple comparison test: P = 0.01 for lighton vs. lightoff in DIO-AAV-ChR2 injected mice). **P = 0.008, paired t-test between lightoff and lighton in ChR group, t = -3.952, 6 degrees of freedom. = 0.946, paired t-test between lightoff and lighton in control group, t = 0.0707, 5 degrees of freedom. m, Top, Schematic representation of the experimental protocol used for analyzing optogenetic manipulations of PKCδ+ neurons during EPM behavior. EPM and open field behaviour was analyzed prior to subjecting animals to fear conditioning. Bottom, Example EPM trajectories of PKCδ-Cre animals injected with rAAV 2/7 EF1α∷DIO-ChR2(H134R)-2A-NpHR-2A-Venus (top) or rAAV 2/5 CBA∷DIO-ARCH-GFP (bottom) under lighton or lightoff conditions. n, Enhancing the activity of PKCδ+ neurons decreases the percentage of time animals spend on open arms (n = 7 mice, **P = 0.006, paired t-test, t = -3.952, 6 degrees of freedom between lightoff and lighton for ChR2 group.), whereas decreasing the activity of PKCδ+ neurons has the opposite effect (n = 6 mice, **P = 0.005, paired t-test, t = -4.702, 5 degrees of freedom between lightoff and lighton for ARCH group.). The behavior of control animals was not altered by light stimulation (n = 9 mice, P = 0.214, aired t-test, t = 1.349, 8 degrees of freedom between lightoff and lighton for control group.). Two-way ANOVA: F(2, 19) = 26.72, P < 0.001 for the interaction injection × light stimulation; post-hoc pairwise Sidak's tests revealed significant differences between lighton in the ARCH group, lighton in the ChR2 and control group. o, Top, Schematic representation of the experimental protocol used for analyzing optogenetic manipulations of PKCδ+ neurons during open field behavior. Bottom, Example open field trajectories of PKCδ-Cre animals injected with rAAV 2/7 EF1α∷DIO-ChR2(H134R)-2A-NpHR-2A-Venus (top) or rAAV 2/5 CBA∷DIO-ARCH-GFP (bottom) under lighton or lightoff conditions. p, Enhancing the activity of PKCδ+ neurons decreases the number of center crossings (red square) per unit track length (n = 7 mice, **P = 0.006, paired t-test between lightoff and lighton for ChR group, t = 4.124, 6 degrees of freedom), whereas decreasing the activity of PKCδ+ neurons has the opposite effect (n = 8 mice, **P = 0.007, aired t-test between lightoff and lighton for ARCH group, t = -3.956, 6 degrees of freedom.). The behavior of control animals was not altered by light stimulation (n = 7 mice, P = 0.408, paired t-test between lightoff and lighton for control group, t = 0.880, 7 degrees of freedom.). Two-way ANOVA: Two-way ANOVA: F(2, 19) = 8.587, P = 0.002 for the interaction injection × light stimulation; post-hoc pairwise Sidak's tests revealed significant differences between lighton in the ARCH group, lighton in the ChR2 and control group. All error bars indicate mean ± s.e.m.