. 2015 Nov;10(11):986-91.
doi: 10.1038/nnano.2015.189. Epub 2015 Aug 31.

High-throughput optical sensing of nucleic acids in a nanopore array

Affiliations

High-throughput optical sensing of nucleic acids in a nanopore array

Shuo Huang et al. Nat Nanotechnol. 2015 Nov.

Abstract

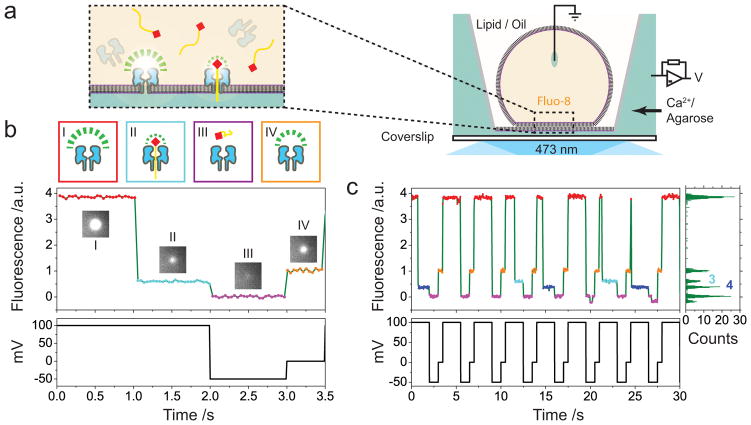
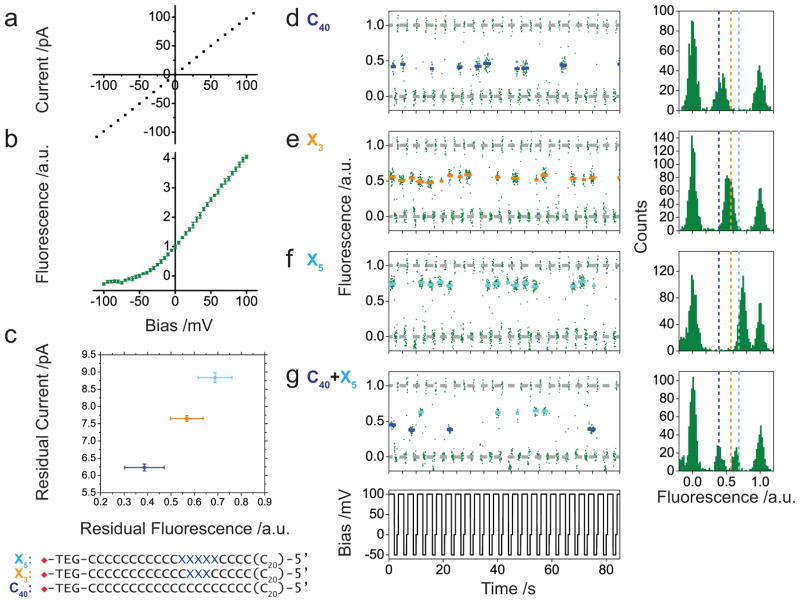
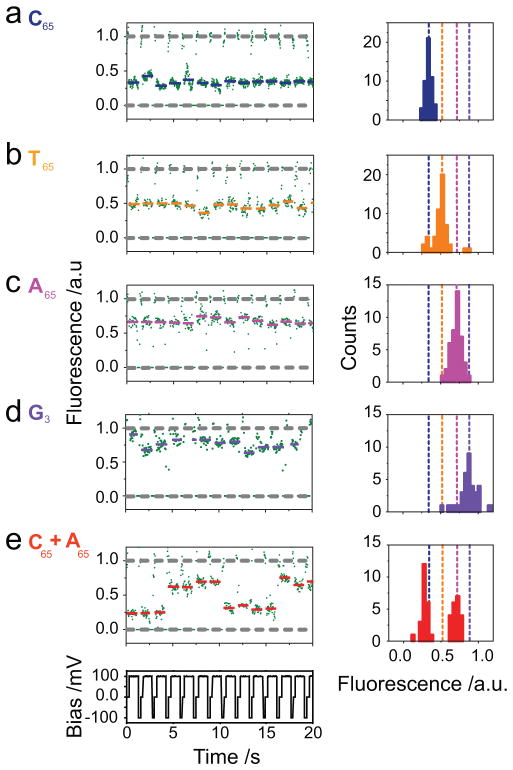
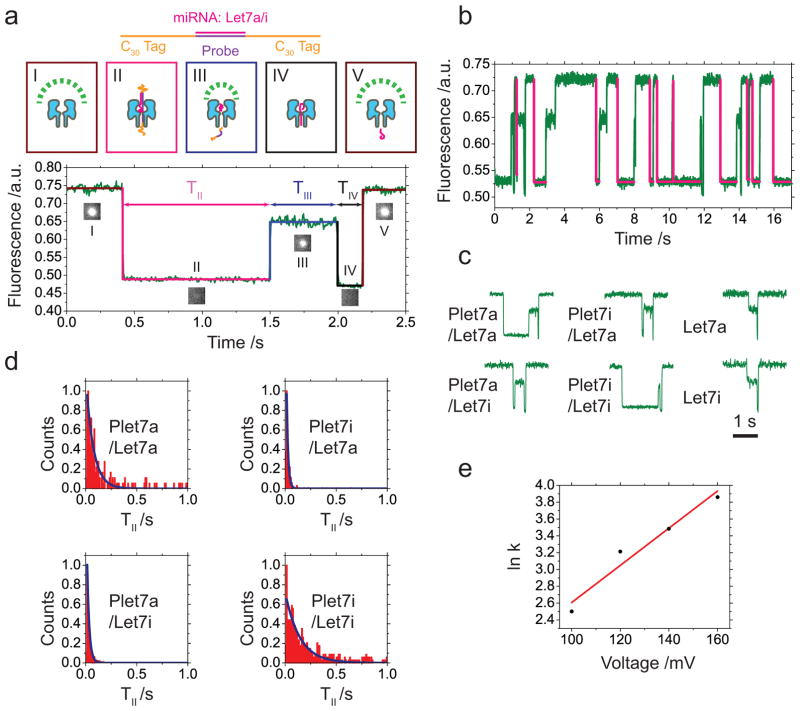
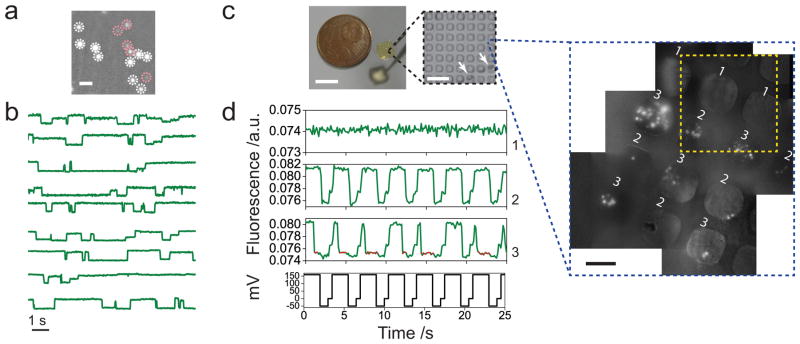
Protein nanopores such as α-haemolysin and Mycobacterium smegmatis porin A (MspA) can be used to sequence long strands of DNA at low cost. To provide high-speed sequencing, large arrays of nanopores are required, but current nanopore sequencing methods rely on ionic current measurements from individually addressed pores and such methods are likely to prove difficult to scale up. Here we show that, by optically encoding the ionic flux through protein nanopores, the discrimination of nucleic acid sequences and the detection of sequence-specific nucleic acid hybridization events can be parallelized. We make optical recordings at a density of ∼10(4) nanopores per mm(2) in a single droplet interface bilayer. Nanopore blockades can discriminate between DNAs with sub-picoampere equivalent resolution, and specific miRNA sequences can be identified by differences in unzipping kinetics. By creating an array of 2,500 bilayers with a micropatterned hydrogel chip, we are also able to load different samples into specific bilayers suitable for high-throughput nanopore recording.


Figures

Figure 1
Figure 1. Optical detection of DNA by αHL in a DIB
(a) Schematic of a single DIB. A 60x TIRF objective is used both for illumination and imaging. A voltage protocol is applied using Ag/AgCl electrodes present in the agarose substrate and in the droplet. The insert shows a cartoon of the detection process. (b) A representative fluorescent trace from a single DNA blockade cycle. Streptavidin tethered ssDNA, which is an anion, is driven into the pore at +100 mV. Simultaneously, the cationic Ca2+ flows oppositely to the DNA flow and binds with Fluo-8 to be fluorescent. (I). Streptavidin (red squares)-tethered ssDNA (yellow line) is driven into the pore, partially blocking the Ca2+ flux (II). At −50 mV, the trapped ssDNA is released (III). The fluorescence at −50 mV diminishes due to the near reversal of the Ca2+ flux at negative potentials. Then the applied bias is returned to 0 mV (IV) and the cycle repeats. The fluorescence at 0 mV comes from the diffusion of Ca2+ from the agarose substrate. The trace amplitude is normalized so that the mean intensities of (III) and (IV) are 0 and 1. The normalized fluorescence amplitude of (II) identifies the captured DNA. (c) A sequence of nanopore blockades with a mixture of two types of DNA (X5, cyan, histogram level 3; C40, blue, histogram level 4). An additional lower fluorescence level at −50 mV is occasionally populated due to gating of the αHL pore at the negative potential.
Figure 2
Figure 2. Amplitude resolution of oSCR for DNA identification
(a) Current – Voltage response from a single αHL nanopore in a BLM (cis: 1.32 M KCl, 8.8 mM HEPES, pH: 7.0; trans: 0.66 M CaCl2, 8.8 mM HEPES, pH: 7.0). (b) The equivalent optical Fluorescence – Voltage relation for a single αHL in a DIB. (c) Comparison of the response from optical and electrical recording for three different DNAs. Error bars for the residual fluorescence represent the standard deviation of 120 events (Supplementary Table 2). Error bars for the residual current represent the full width at half maximum (FWHM) of the peak fitting (Supplementary Table 4, Supplementary Figure 7). (d–g), Normalized fluorescence traces (Supplementary Methods 5) for different types of streptavidin-tethered ssDNA (d, C40; e, X3; f, X5; g, C40+X5). The fluorescence intensity is normalized so that the amplitude is 0 at −50 mV and 1 at 0 mV when the pore is open. Each blockade is fitted to the mean value of the corresponding data points and overlaid with colour-coded bars. All-points histograms are displayed on the right of each trace. The centre of the colour-coded dashed lines is assigned according to the mean values for each type of DNA blockade as shown in Figure 2c. C40 and X5 are distinguished in g by a 50% threshold between the mean amplitudes corresponding to the two states. The total DNA concentration in the droplet for df: 267 nM. For g: 133.5 nM each for C40 and X5.
Figure 3
Figure 3. Optical discrimination of four nucleotides using the MspA M2 nanopore
When streptavidin-tethered biotinylated DNA oligonucleotides block a pore, the ion flux is restricted and we observe a reversible stepwise change in the fluorescence intensity. (ad), Normalized optical traces (Supplementary Methods 6) for the following 65-mers (Supplementary Table 1): C65 (5′-Biotin-CCCCCCCCCCCC-CCC-C35-CCTGTCTCCCTGCCG-3′), T65 (5′-Biotin-TTTTTTTTTTTT-TTT-T35-CCTGTCTCCCTGCCG-3′), A65 (5′-Biotin-AAAAAAAAAAAA-AAA-A35-CCTGTCTCCCTGCCG-3′) or G3 in background of A65 (5′-Biotin-AAAAAAAAAAAA-GGG-A35-CCTGTCTCCCTGCCG-3′). The blockades are fitted to the mean value of the corresponding data points and represented with a coloured bar. Event histograms displaying the mean amplitudes are on the right of the traces for each DNA oligonucleotide (Supplementary Table 3). (e), Normalized optical trace and corresponding event histogram for a mixture of C65 and A65.
Figure 4
Figure 4. Detection of miRNA sequences by oSCR based on unzipping event duration
(a) A representative miRNA unzipping event. miRNA (Let7a or Let7i) hybridizes with the DNA probe (Plet7a or Plet7i). Poly-C30 ssDNA tags on both ends of the probe are designed to enable pore-threading and initiate unzipping. At +160 mV, an open nanopore (I) shows a decrease in fluorescence when the hybridized complex is captured and subsequently unzipped (II). Following unzipping, when the DNA probe has translocated through the pore the miRNA remains in the vestibule (III). The miRNA then translocates (IV) and the pore re-opens (V). (b) A series of miRNA (Plet7a/Let7a) unzipping events at +160 mV. Magenta fitting lines (Supplementary Figure 9) highlight capture/unzipping (II) events. (c) Different probe/miRNA combinations show different capture/unzipping times (II). Matched miRNA and probe generate long events. miRNA without probe shows no capture/unzipping events (II). (d) Histograms of capture/unzipping event (II) lifetimes for all the probe/miRNA combinations fit with exponentials. The fitted rate constant for unzipping reflects the hybridization strength (Supplementary Text 2). (e) Dependence of the unzipping rate constant on applied potential for Plet7a/Let7i (Supplementary Figure 11).
Figure 5
Figure 5. High throughput and multi-sample oSCR
(a) A frame containing multiple fluorescence spots representing open (white dashed circles) and blocked nanopores (pink dashed circles, DNA: streptavidin tethered C40). Scale bar: 10 μm. (b) Parallel recordings of nine fluorescence traces simultaneously extracted from the same field of view. The fluorescence traces show spontaneous amplitude transitions due to consecutive miRNA (Plet7a/Let7i) capture/unzipping events (Supplementary Video 4). oSCR results in a and b are both recorded in DIBs. (c) A Fluo-8 containing hydrogel chip with cast pillar-array layer, scale bar: 4 mm (Supplementary Figure 13). The image inset in a black dashed square shows separation of the formed bilayers from the unformed. After HHBa formation (Supplementary Video 6), the pillar array is lifted slowly to separate the bilayers. Boundary lines delimiting the area containing formed bilayers are visualized (white arrows). Scale bar: 140 μm. Inset in blue dashed square: multiple fluorescence images have been stitched together to show an expanded view of an area of the chip containing various biological samples (1. −αHL, -DNA; 2. +αHL, -DNA; 3. +αHL, +DNA). Yellow dashed square: a single frame accommodates four bilayers at a time. Scale bar: 40 μm. (d) Parallel single-molecule nanopore activity from a full frame HHBa recording. The fluorescence traces are recorded simultaneously from nanopores in different bilayers of the array (see c, yellow dashed square). The unspotted HHB shows constant fluorescence (Trace 1). The HHB loaded with αHL shows fluorescence changes synchronized with the voltage protocol (Trace 2). DNA (C40) blockades (red points on the trace) are only detected in Trace 3.

References

    1. Mardis ER. Anticipating the $1,000 genome. Genome Biology. 2006;7:12. - PMC - PubMed
    1. Bayley H. Sequencing single molecules of DNA. Current Opinion in Chemical Biology. 2006;10:628–637. - PubMed
    1. Xuan JK, Yu Y, Qing T, Guo L, Shi LM. Next-generation sequencing in the clinic: Promises and challenges. Cancer Letters. 2013;340:284–295. - PMC - PubMed
    1. Branton D, et al. The potential and challenges of nanopore sequencing. Nat Biotechnol. 2008;26:1146–1153. - PMC - PubMed
    1. Venkatesan BM, Bashir R. Nanopore sensors for nucleic acid analysis. Nature Nanotech. 2011;6:615–624. - PubMed

Publication types