

Application of Deamidated Gliadin Antibodies in the Follow-Up of Treated Celiac Disease
- PMID: 26322980
- PMCID: PMC4554732
- DOI: 10.1371/journal.pone.0136745
Application of Deamidated Gliadin Antibodies in the Follow-Up of Treated Celiac Disease
Abstract
Introduction: The role of serological tests such as IgA anti-transglutaminase autoantibodies has become increasingly important in celiac disease (CD) diagnosis. However, the efficiency of these tests for patient follow-up is controversial. We investigated the correlation of 12 different serological tests, including recent deamidated gliadin and actin IgA tests, with villous atrophy (VA) in a retrospective cohort of treated celiac patients.
Materials and methods: Serum samples were collected from 100 treated CD patients who had intestinal biopsy in the course of their follow-up. Antibodies against transglutaminase, deamidated gliadin peptides, and native gliadin were measured, along with IgA anti-actin. The biopsy slides were all blind-reviewed and scored according to Marsh classification.
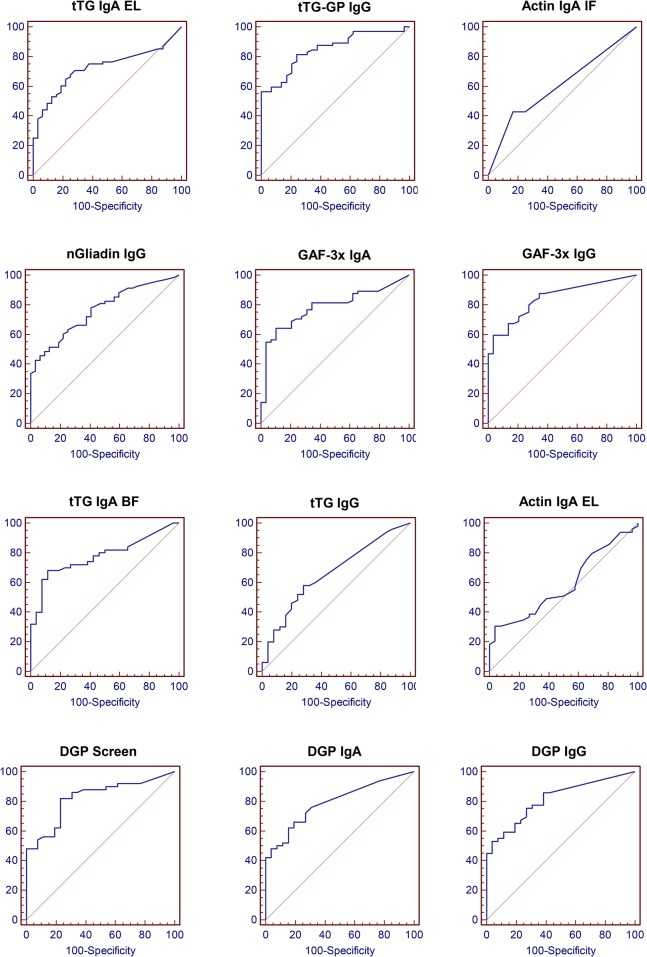
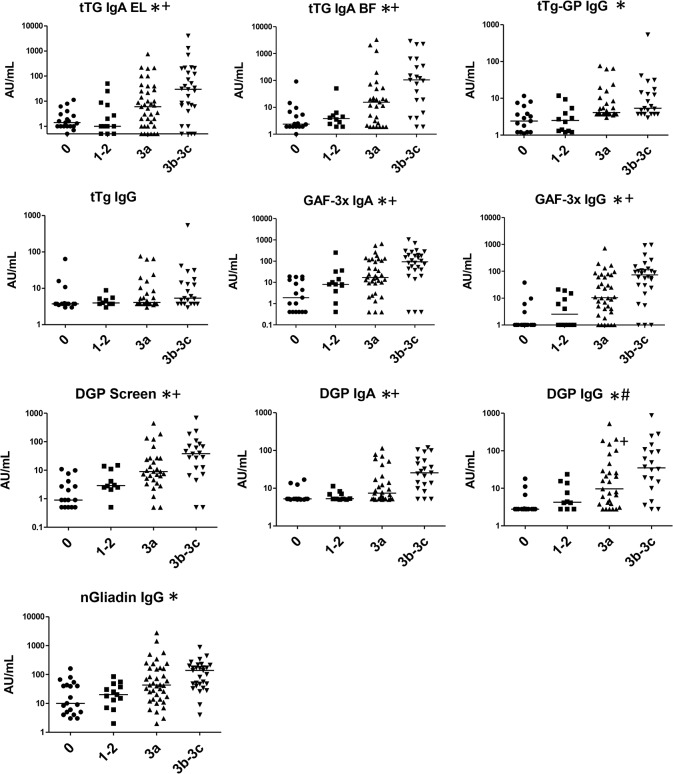
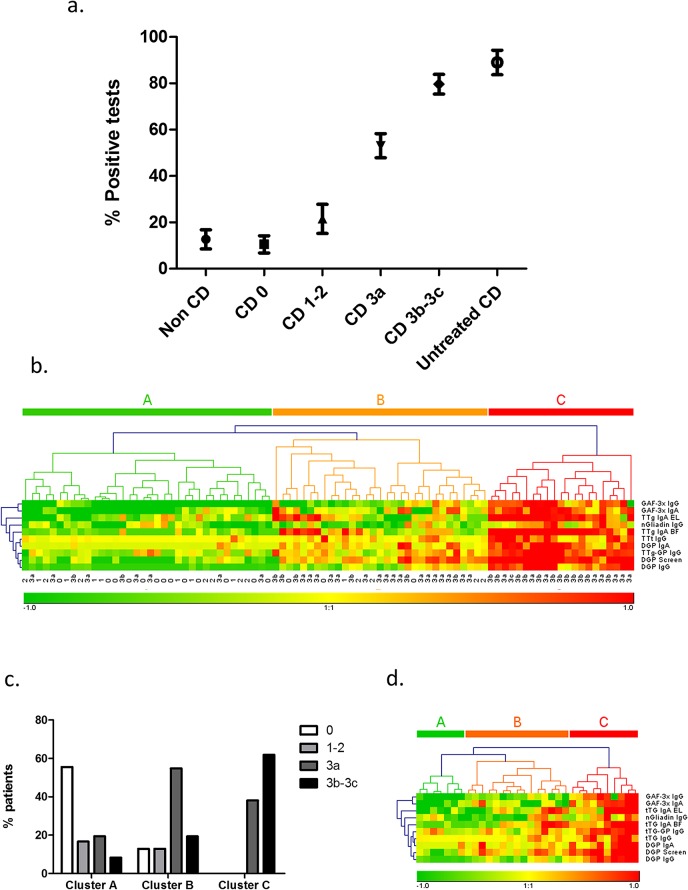
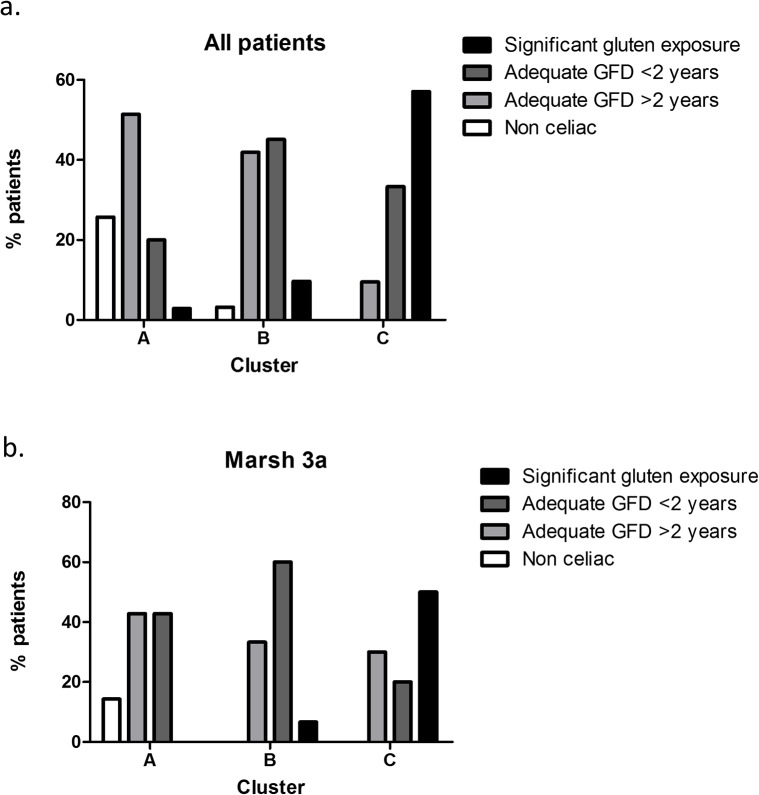
Results: For all deamidated gliadin and transglutaminase tests, we found that a positive result was significantly associated with persistence of intestinal VA, with a diagnostic efficacy up to 80%. Furthermore, antibodies titers directly correlated with the degree of VA, indicating a strong link between disease activity and presence of antibodies in the serum. Interestingly, the tests with the highest association with persistent VA were those for deamidated gliadin IgG. Using a test positivity pattern analysis, we were also able to identify several groups of patients with distinct antibody profiles that showed significant differences in intestinal damage and diet compliance.
Conclusions: Altogether, these results show that deamidated gliadin antibodies are strongly correlated with VA and should be considered valuable tools in CD follow-up and that multiplex serologic analysis for treated CD represents a promising tool for personalized patient management.
Conflict of interest statement
Figures
Similar articles
-
Diagnostic utility of deamidated gliadin peptide antibody in celiac disease compared to anti-tissue transglutaminase and IgA- endomysium antibodies.Egypt J Immunol. 2012;19(2):41-52. Egypt J Immunol. 2012. PMID: 23885406
-
Extension of the celiac intestinal antibody (CIA) pattern through eight antibody assessments in fecal supernatants from patients with celiac disease.Immunobiology. 2016 Jan;221(1):63-9. doi: 10.1016/j.imbio.2015.07.021. Epub 2015 Jul 26. Immunobiology. 2016. PMID: 26271834
-
[Anti-deamidated gliadin peptides antibodies and coeliac disease: state of art and analysis of false-positive results from five assays].Ann Biol Clin (Paris). 2010 Mar-Apr;68(2):149-56. doi: 10.1684/abc.2010.0398. Ann Biol Clin (Paris). 2010. PMID: 20348047 French.
-
AGA Clinical Practice Update on Diagnosis and Monitoring of Celiac Disease-Changing Utility of Serology and Histologic Measures: Expert Review.Gastroenterology. 2019 Mar;156(4):885-889. doi: 10.1053/j.gastro.2018.12.010. Epub 2018 Dec 19. Gastroenterology. 2019. PMID: 30578783 Free PMC article. Review.
-
Accuracy of diagnostic antibody tests for coeliac disease in children: summary of an evidence report.J Pediatr Gastroenterol Nutr. 2012 Feb;54(2):229-41. doi: 10.1097/MPG.0b013e318216f2e5. J Pediatr Gastroenterol Nutr. 2012. PMID: 22266486 Review.
Cited by
-
Indications and Use of the Gluten Contamination Elimination Diet for Patients with Non-Responsive Celiac Disease.Nutrients. 2017 Oct 18;9(10):1129. doi: 10.3390/nu9101129. Nutrients. 2017. PMID: 29057833 Free PMC article. Review.
-
Letter: Celiac Disease Presenting After a Single Anastomosis Duodeno-Ileal Bypass and Sleeve Gastrectomy.Obes Surg. 2019 Mar;29(3):1018-1021. doi: 10.1007/s11695-018-03678-3. Obes Surg. 2019. PMID: 30637519 No abstract available.
-
Coeliac disease in infants: antibodies to deamidated gliadin peptide come first!Ital J Pediatr. 2017 Aug 10;43(1):70. doi: 10.1186/s13052-017-0392-6. Ital J Pediatr. 2017. PMID: 28797308 Free PMC article.
-
Value of IgA tTG in Predicting Mucosal Recovery in Children With Celiac Disease on a Gluten-Free Diet.J Pediatr Gastroenterol Nutr. 2017 Feb;64(2):286-291. doi: 10.1097/MPG.0000000000001460. J Pediatr Gastroenterol Nutr. 2017. PMID: 28112686 Free PMC article.
-
Pediatric Celiac Disease: Follow-Up in the Spotlight.Adv Nutr. 2017 Mar 15;8(2):356-361. doi: 10.3945/an.116.013292. Print 2017 Mar. Adv Nutr. 2017. PMID: 28298278 Free PMC article. Review.
References
-
- Green PH, Cellier C. Celiac disease. N Engl J Med. 2007;357(17):1731–43. . - PubMed
-
- Green PH, Rostami K, Marsh MN. Diagnosis of coeliac disease. Best Pract Res Clin Gastroenterol. 2005;19(3):389–400. . - PubMed
-
- Husby S, Koletzko S, Korponay-Szabo IR, Mearin ML, Phillips A, Shamir R, et al. European Society for Pediatric Gastroenterology, Hepatology, and Nutrition guidelines for the diagnosis of coeliac disease. J Pediatr Gastroenterol Nutr. 2012;54(1):136–60. Epub 2011/12/27. 10.1097/MPG.0b013e31821a23d0 . - DOI - PubMed
MeSH terms
Substances
LinkOut - more resources
Full Text Sources
Other Literature Sources
Medical
Miscellaneous
