. 2015 Oct;47(10):1179-1186.
doi: 10.1038/ng.3393. Epub 2015 Aug 31.

Polycomb repressive complex PRC1 spatially constrains the mouse embryonic stem cell genome

Affiliations

Polycomb repressive complex PRC1 spatially constrains the mouse embryonic stem cell genome

Stefan Schoenfelder et al. Nat Genet. 2015 Oct.

Abstract

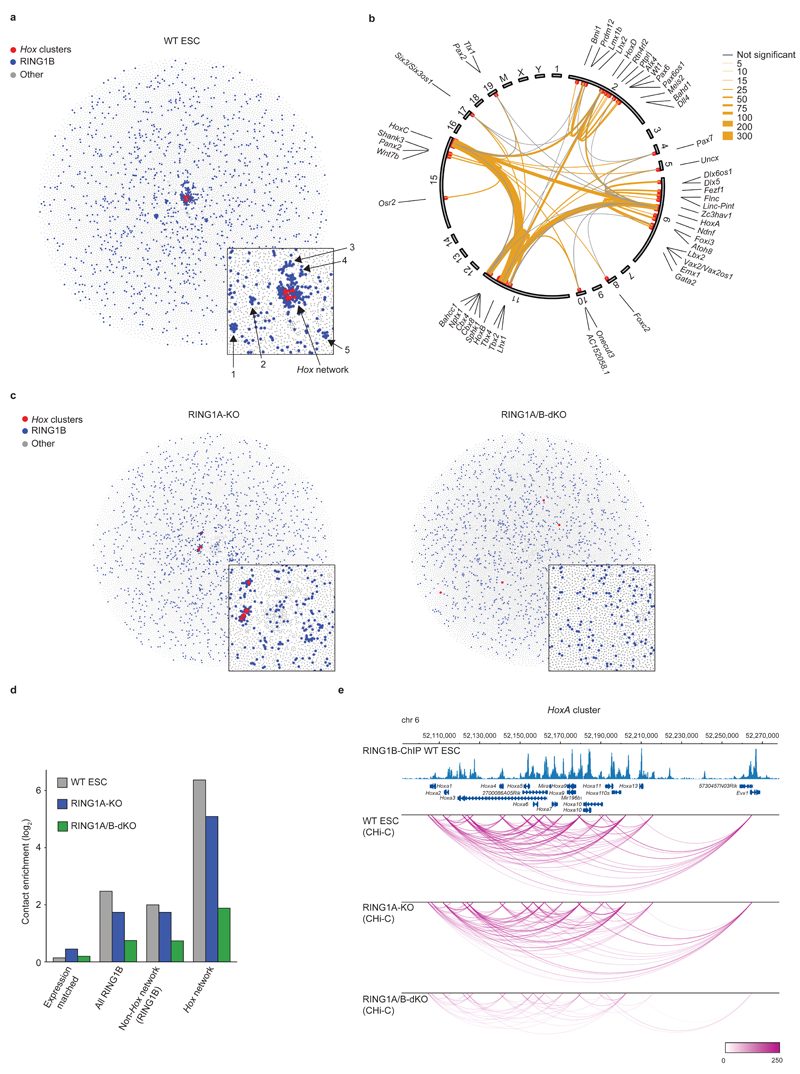
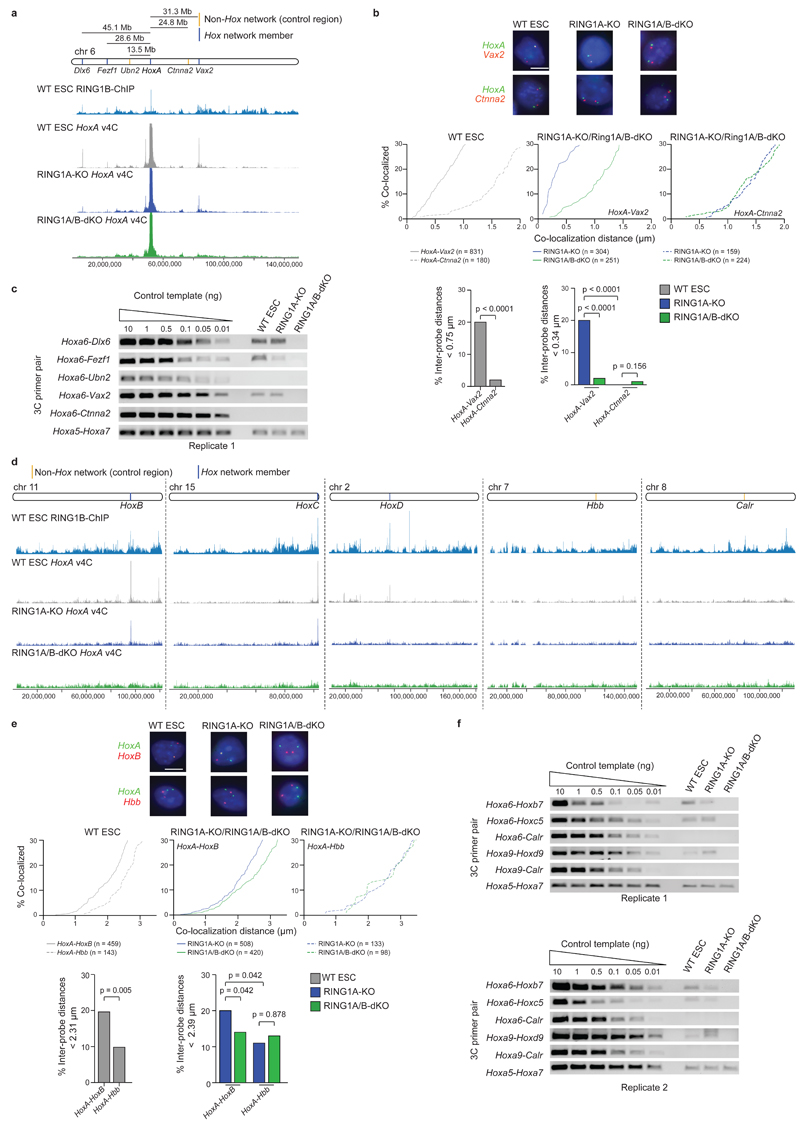
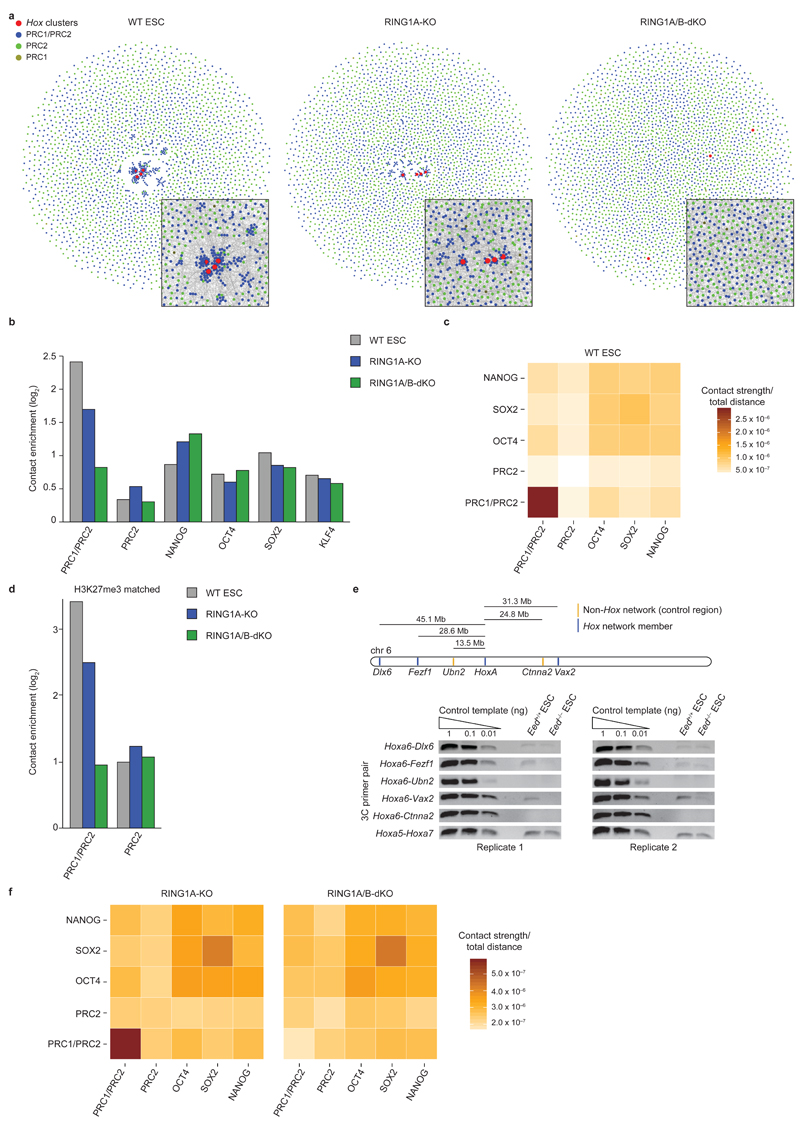
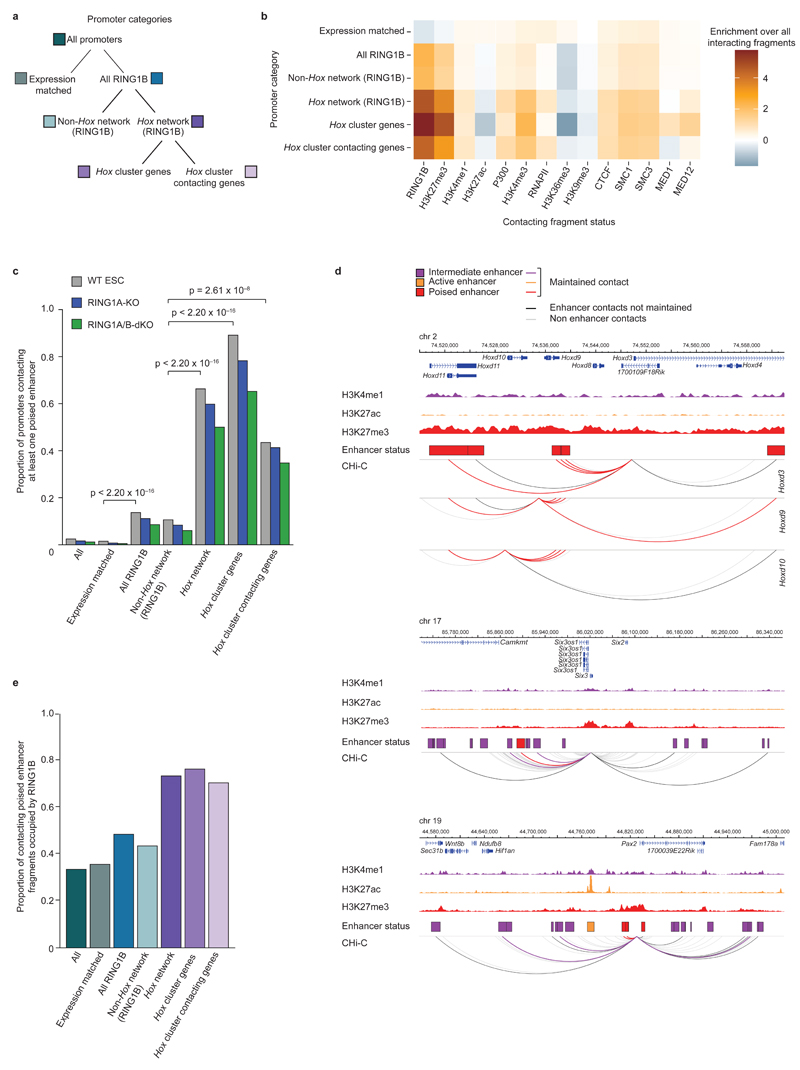
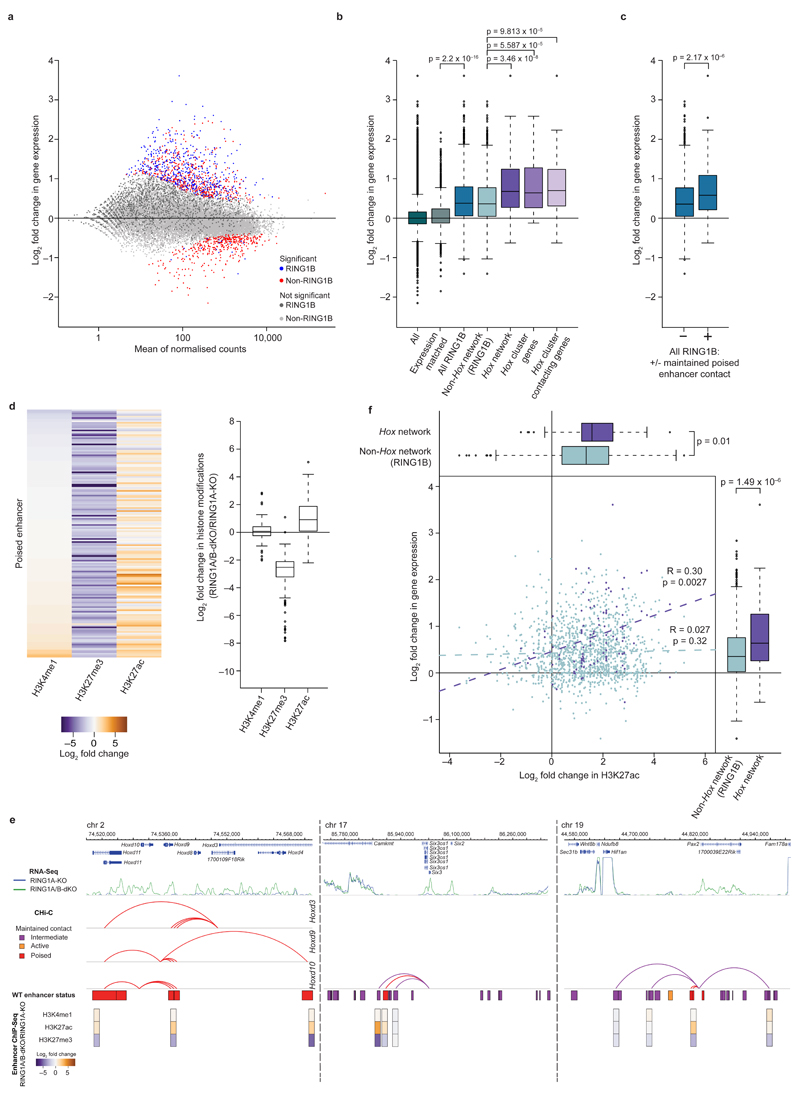
The Polycomb repressive complexes PRC1 and PRC2 maintain embryonic stem cell (ESC) pluripotency by silencing lineage-specifying developmental regulator genes. Emerging evidence suggests that Polycomb complexes act through controlling spatial genome organization. We show that PRC1 functions as a master regulator of mouse ESC genome architecture by organizing genes in three-dimensional interaction networks. The strongest spatial network is composed of the four Hox gene clusters and early developmental transcription factor genes, the majority of which contact poised enhancers. Removal of Polycomb repression leads to disruption of promoter-promoter contacts in the Hox gene network. In contrast, promoter-enhancer contacts are maintained in the absence of Polycomb repression, with accompanying widespread acquisition of active chromatin signatures at network enhancers and pronounced transcriptional upregulation of network genes. Thus, PRC1 physically constrains developmental transcription factor genes and their enhancers in a silenced but poised spatial network. We propose that the selective release of genes from this spatial network underlies cell fate specification during early embryonic development.


Conflict of interest statement

Competing Financial Interests

The authors declare no competing financial interests.

Figures

Figure 1 |
Figure 1 |. PRC1 organizes 3D promoter-promoter contact networks in ESCs.
a, Network map of spatial promoter connectivity in WT mouse ESCs. Red nodes: Hox clusters; blue nodes: RING1B-occupied promoters (non-Hox cluster); grey nodes: non RING1B-occupied promoters. Promoter nodes are connected by edges (not drawn) representing long-range cis (> 10 Mb) or trans Promoter CHi-C contacts. Promoter nodes are positioned using a force-directed layout such that connected nodes are drawn closer together. Inset; zoom in on the Hox network and the five smaller networks. b, Hox network circos contact map in WT ESCs. Inner circle: chromosomes; outer circle: genes names; red dots: significantly interacting RING1B-bound promoters; edges: significant promoter contacts (orange, weighted by read count) and non-significant contacts (grey, minimum of 3 reads). c, Network analysis in RING1A-KO and RING1A/B-dKO cells as in (a). d, Contact enrichment for Hox network promoters, RING1B non-Hox network promoters, all RING1B-bound promoters, and expression-matched non RING1B-bound promoters. e, Significant promoter-promoter CHi-C contacts (arcs) within the HoxA cluster for WT, RING1A-KO and RING1A/B-dKO cells (WashU Epigenome Browser30). Upper tracks: Genomic coordinates, RefSeq genes, and WT RING1B ChIP-Seq profile.
Figure 2 |
Figure 2 |. Validation of a PRC1-dependent 3D promoter-promoter contact network in ESCs.
Validation of selected HoxA cis (a-c) and trans (d-f) contacts by double-label 3D DNA FISH and 3C-PCR. a, d, Genomic locations of tested loci, RING1B ChIP-Seq signal from WT ESCs and virtual 4C (v4C) contacts, generated from Promoter CHi-C data, using the HoxA cluster as a viewpoint. b, e, Representative double-label 3D DNA FISH images showing probe signals for HoxA, Ctnna2, and Vax2 (b), and HoxA, HoxB and Hbb (e). Scale bars, 5 µm. Cumulative frequency distribution plots show the percentage of alleles co-localizing at increasing distance cut-offs. Bar plots show percentage of inter-probe distances below the specified cut-off, set at the distance which includes the lowest quintile of measurements for Hox network member alleles in WT or RING1A-KO ESCs. P values: Mann-Whitney test (comparison of inter-probe distances within the same cell) and Kruskall-Wallis/Dunn’s multiple comparisons test (comparison of inter-probe distances between RING1A-KO and RING1A/B-dKO cells). c, f, 3C-PCR validation of HoxA cluster long-range contacts for regions identified by Promoter CHi-C as making PRC1-dependent contacts with HoxA in cis (c) (Dlx6, Fezf1, and Vax2) and trans (f) (HoxB, HoxC, and HoxD); and control regions identified as non-HoxA contacting regions in cis (c) (Ubn2, Ctnna2) and trans (f) (Calr). Full-length gels are presented in Supplementary Data Set 1.
Figure 3 |
Figure 3 |. PRC1 is a key regulator of 3D genome architecture in ESCs.
a, Network maps of spatial connectivity between PRC-bound gene promoters (display as in Fig. 1a). Red nodes: Hox gene promoters; blue nodes: PRC1/PRC2-bound promoters; green nodes: PRC2-bound promoters; gold nodes: PRC1-bound promoters. Insets: zoom-in of network center, but showing edges representing significant promoter contacts. b, Contact enrichment for PRC1/PRC2, PRC2, and pluripotency factor occupied promoters. c, Cumulative contact strengths between polycomb and pluripotency factor bound promoters in WT ESCs, normalized with the sum of all possible contact-distances within that group. d, Contact enrichment for subsets of PRC1/PRC2- and PRC2-bound promoters with matched H3K27me3 occupancy. e, 3C-PCR analyses of HoxA contacts in WT (Eed+/+) and EED-KO (Eed-/-) ESCs. Full-length gels are presented in Supplementary Data Set 1. f, Cumulative contact strengths between polycomb and pluripotency factor bound promoters in RING1A-KO and RING1A/B-dKO cells, normalized with the sum of all possible contact-distances within that group.
Figure 4 |
Figure 4 |. PRC1-bound promoters preferentially contact poised enhancers.
a, Schematic of promoter categories used for subsequent analyses. b, Heat map showing the enrichment/depletion of histone modifications and chromatin proteins at promoter-contacting regions. c, Proportion of promoters contacting one or more poised enhancers in WT ESCs (grey), and maintaining one or more poised enhancer contacts in RING1A-KO (blue) and RING1A/B-dKO (green) cells. P values: Fisher’s exact test (WT ESC proportions). d, WT ESC CHi-C contact profiles of Hoxd9/Hoxd10/Hoxd13, Six3 and Pax2 promoters. Upper track within each panel: genomic coordinates and RefSeq genes. Middle tracks: H3K4me1, H3K27ac, and H3K27me3 ChIP-Seq signals; boxes represent HindIII fragments overlapping an enhancer (purple: intermediate; orange: active; red: poised). Lower track: Promoter CHi-C contacts for viewpoints are displayed as arcs (WashU Epigenome Browser30). Purple, orange and red arcs: promoter-enhancer contacts maintained in RING1A/B-dKO cells. Black arcs: promoter-enhancer contacts lost in RING1A/B-dKO cells. Grey arcs: promoter contacts with non-enhancer regions. e, WT RING1B occupancy at poised enhancers (for enhancers with maintained promoter contacts).
Figure 5 |
Figure 5 |. The Hox spatial network is poised for transcription.
a, Expression in RING1A/B-dKO relative to RING1A-KO cells (nuclear RNA-Seq). Blue, red: significant changes (FDR < 0.05); light and dark grey: non-significant changes. Dark grey, blue: RING1B-occupied promoters. b, Expression in RING1A/B-dKO relative to RING1A-KO cells, grouped by promoter categories. Boxplots: median, interquartile range, range and outliers (> 1.5 times the interquartile range away from the box). P values: Wilcoxon rank-sum test. c, Expression in RING1A/B-dKO relative to RING1A-KO cells for RING1B-occupied promoters with (+) or without (−) a maintained poised enhancer contact. P value: Wilcoxon rank-sum test. d, Histone modification changes in RING1A/B-dKO relative to RING1A-KO cells at poised enhancers with maintained RING1B promoter contacts. Left: heat map representing individual enhancers. Right: boxplot summaries. e, Transcription, Promoter CHi-C contacts and contacting enhancer status for Hoxd9/Hoxd10/Hoxd13, Six3 and Pax2. Upper tracks: genomic coordinates, RefSeq genes and RNA-Seq signal (RING1A-KO and RING1A/B-dKO cells). Middle tracks: arcs represent promoter-enhancer contacts maintained in RING1A/B-dKO cells, boxes show HindIII fragments overlapping enhancers defined in WT cells. Lower tracks: histone modification changes at enhancers in RING1A/B-dKO relative to RING1A-KO cells (boxes centered on the precise enhancer location). f, Scatter plot: Enhancer H3K27ac and gene expression changes in RING1A/B-dKO relative to RING1A-KO cells, for RING1B Hox network promoters (purple) and RING1B non-Hox network promoters (light blue) with maintained contacts to poised or intermediate enhancers. P and R values: Pearson's product-moment correlation. Boxplots: maximal H3K27ac change at enhancers (top) and expression changes (right) for RING1B Hox network and non-Hox network genes. P values: Wilcoxon rank-sum test.

Comment in

References

    1. Simon JA, Kingston RE. Occupying chromatin: Polycomb mechanisms for getting to genomic targets, stopping transcriptional traffic, and staying put. Mol Cell. 2013;49:808–824. - PMC - PubMed
    1. Bantignies F, et al. Polycomb-dependent regulatory contacts between distant Hox loci in Drosophila. Cell. 2011;144:214–226. - PubMed
    1. Sexton T, et al. Three-dimensional folding and functional organization principles of the Drosophila genome. Cell. 2012;148:458–472. - PubMed
    1. Eskeland R, et al. Ring1B compacts chromatin structure and represses gene expression independent of histone ubiquitination. Mol Cell. 2010;38:452–464. - PMC - PubMed
    1. Denholtz M, et al. Long-range chromatin contacts in embryonic stem cells reveal a role for pluripotency factors and polycomb proteins in genome organization. Cell Stem Cell. 2013;13:602–616. - PMC - PubMed

Publication types

Substances