. 2015 Aug 31;210(5):705-16.
doi: 10.1083/jcb.201503044.

Degradation of HK2 by chaperone-mediated autophagy promotes metabolic catastrophe and cell death

Affiliations

Degradation of HK2 by chaperone-mediated autophagy promotes metabolic catastrophe and cell death

Hong-Guang Xia et al. J Cell Biol. .

Erratum in

Abstract

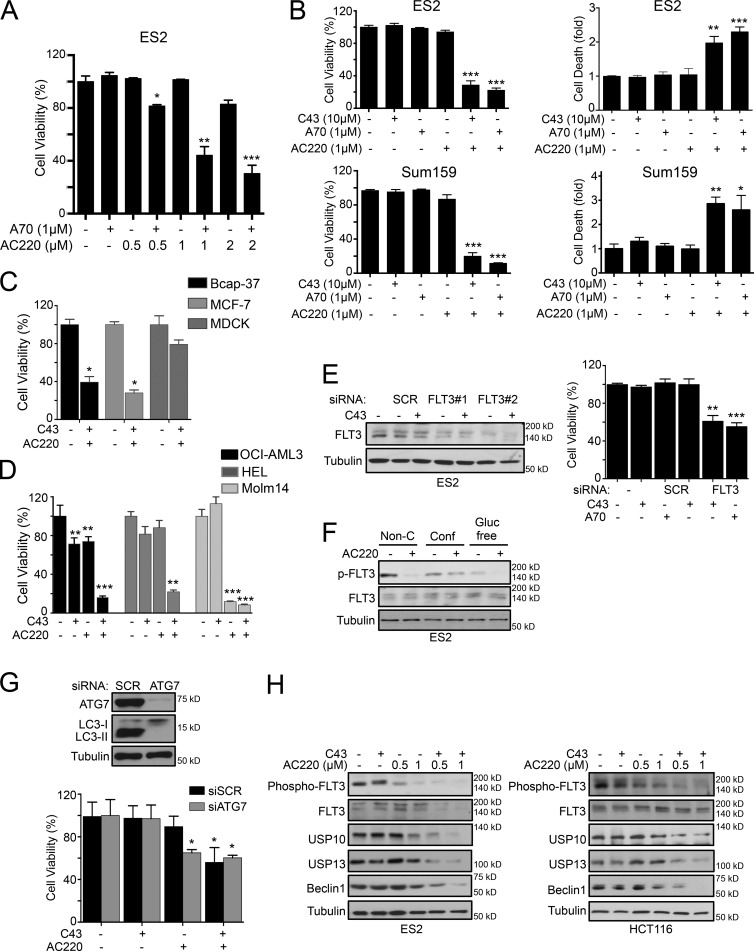
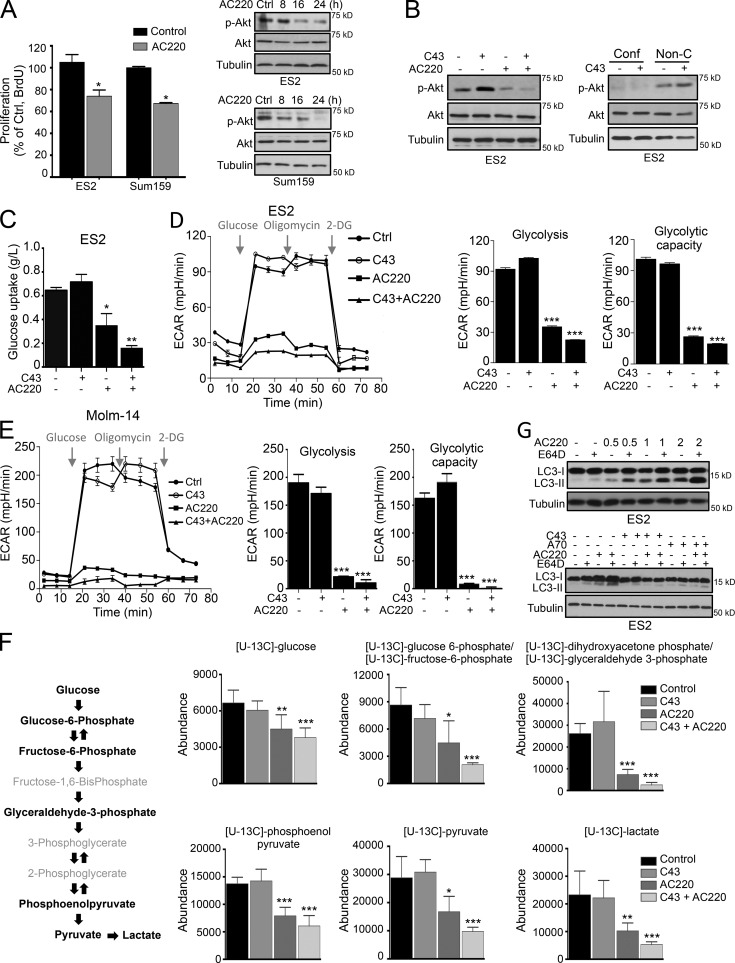
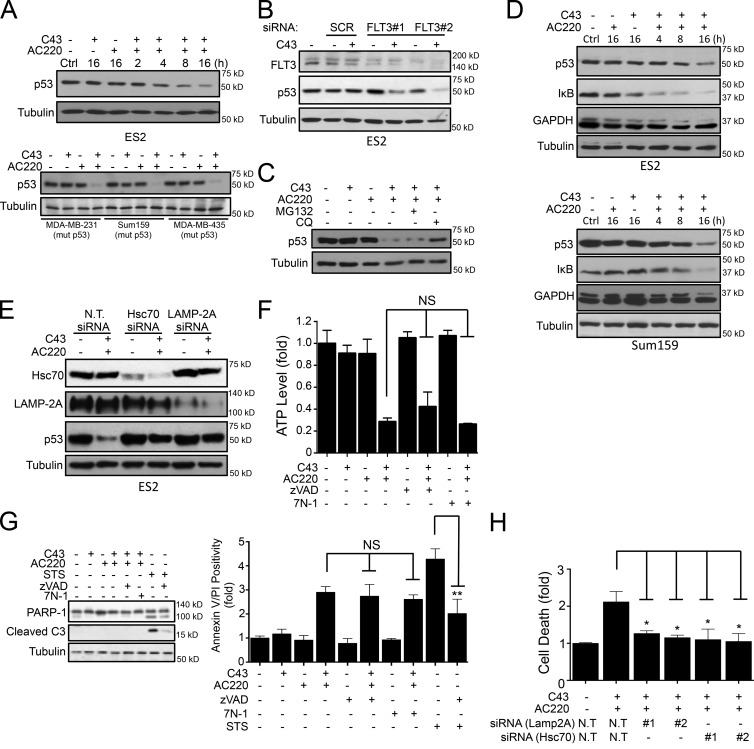
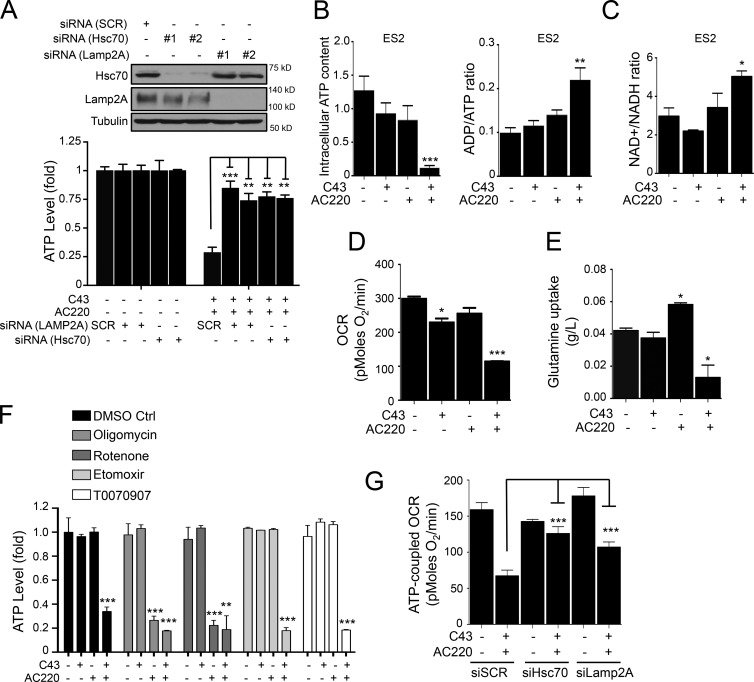
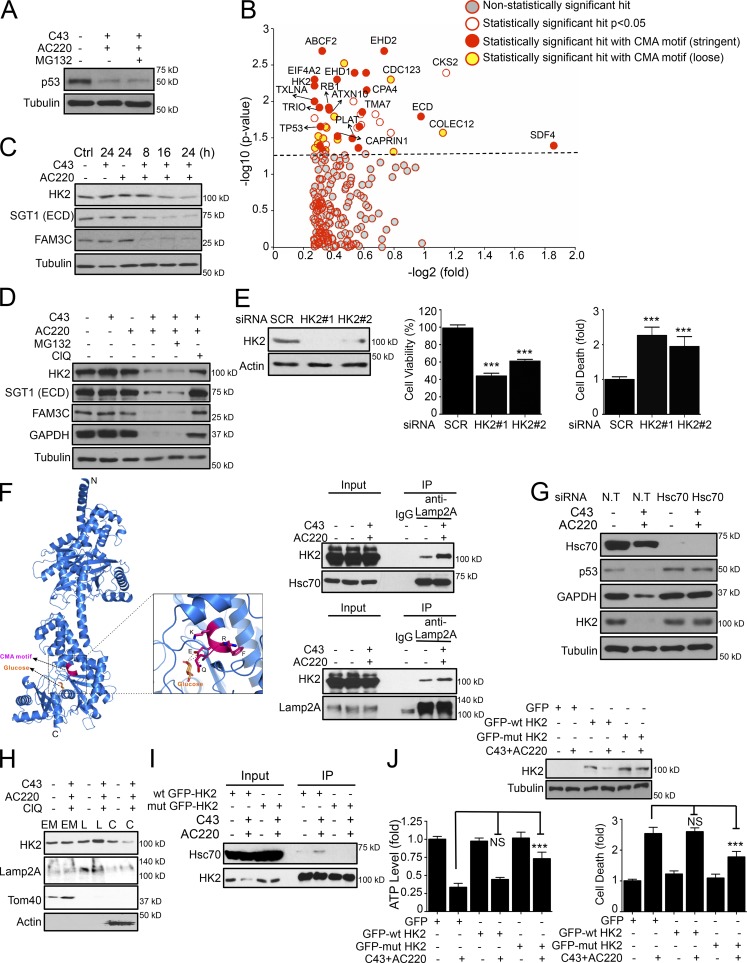
Hexokinase II (HK2), a key enzyme involved in glucose metabolism, is regulated by growth factor signaling and is required for initiation and maintenance of tumors. Here we show that metabolic stress triggered by perturbation of receptor tyrosine kinase FLT3 in non-acute myeloid leukemia cells sensitizes cancer cells to autophagy inhibition and leads to excessive activation of chaperone-mediated autophagy (CMA). Our data demonstrate that FLT3 is an important sensor of cellular nutritional state and elucidate the role and molecular mechanism of CMA in metabolic regulation and mediating cancer cell death. Importantly, our proteome analysis revealed that HK2 is a CMA substrate and that its degradation by CMA is regulated by glucose availability. We reveal a new mechanism by which excessive activation of CMA may be exploited pharmacologically to eliminate cancer cells by inhibiting both FLT3 and autophagy. Our study delineates a novel pharmacological strategy to promote the degradation of HK2 in cancer cells.


Figures

Figure 1.
Figure 1.
FLT3 inhibition sensitized nonconfluent cancer cells to spautins. (A) Cell viability (%) of ES2 cells treated with increasing concentrations of AC220 and/or A70 for 24 h. (B) Cell viability (%) and cell death (fold) of ES2 and Sum159 cells treated with AC220 and/or C43 or A70 for 24 h. (C and D) Cell viability (%) of Bcap-37, MCF-7, and MDCK cells (C) and of OCI-AML3, HEL, and Molm-14 cells (D), treated with AC220 and C43 for 24 h. (E) Cell viability (%) of scramble (SCR) or FLT3 siRNA–transfected ES2 cells treated with C43 for 24 h. WB confirmed the FLT3 siRNA efficiency. (F) Phospho- and total FLT3 protein levels of ES2 cells cultured in confluent (Conf), nonconfluent (Non-C), or glucose-free (Gluc free) conditions, treated with AC220 for 24 h. (G) Cell viability (%) of scramble (SCR) or ATG7 siRNA–transfected ES2 cells treated with AC220 or C43 for 24 h. (H) WB of indicated proteins in ES2 and HCT116 cells treated with increasing concentrations of AC220 and/or C43 for 24 h. Anti–α-tubulin was used as a loading control. Cells were treated with 0.1% DMSO (control: vehicle) or 1 µM AC220 and 10 µM C43, unless otherwise stated. In all the experiments, treatment groups were compared with control group, unless otherwise indicated. Error bars indicate ±SD. *, P < 0.05; **, P < 0.01; ***, P < 0.001.
Figure 2.
Figure 2.
Treatment with AC220 (Quizartinib) reduces glycolysis and induces macroautophagy. (A) Proliferation capacity (%) of ES2 and Sum159 cells treated with AC220 for 16 h. Phospho- and total Akt levels of ES2 and Sum159 cells treated with AC220 up to 24 h. (B) WB of phospho- and total Akt levels of ES2 cells treated with AC220 and C43 (left), or C43 alone in confluent (Conf) or nonconfluent (Non-C) conditions (right) for 24 h. (C) Relative change in glucose levels in the culture medium of ES2 cells treated with AC220 and/or C43 (normalized to cell numbers) for 16 h. (D and E) The glycolytic activity and maximum glycolytic capacity of ES2 (D) or Molm-14 (E) cells, determined by ECAR, after AC220 and C43 treatment for 12 h (ES2) or 8 h (Molm-14). (F) Glucose flux analysis using [U13C]glucose. A schematic depiction of intermediary metabolites of glycolysis is shown. 13C enrichment of intracellular glucose-derived metabolites, marked in bold, is presented. (G) WB of LC3 protein levels in ES2 cells, treated with increasing concentrations of AC220 and/or 5 µM E64D for 16 h (top), or treated with C43 or A70 in combination with AC220 and/or 5 µM E64D for 24 h. Anti–α-tubulin was used as a loading control. Cells were treated with 0.1% DMSO (control: vehicle), 1 µM AC220, 10 µM C43, or 1 µM A70, unless otherwise stated. In all the experiments, treatment groups were compared with the control group, unless otherwise shown. Error bars indicate ±SD. *, P < 0.05; **, P < 0.01; ***, P < 0.001.
Figure 3.
Figure 3.
Combination treatment of AC220 and spautins induces CMA. (A) WB quantification of mutant p53 levels in ES2 (top) for the indicated time points and in MDA-MB-231, Sum159, and MDA-MB-435 (bottom) cells treated with AC220 and/or C43 for 16 h. (B) Mutant p53 levels in scramble (SCR) or FLT3 siRNA–transfected ES2 cells treated with C43 for 24 h. This experiment used the same blot as that in Fig. 1 E with additional antibodies. (C) p53 levels in ES2 cells treated with C43 and AC220 for 24 h in the absence or presence of proteasome (MG132) or lysosomal inhibitor (ClQ). (D) p53, IκB, and GAPDH levels in ES2 and Sum159 cells treated with AC220 and/or C43 for the indicated time points. (E) WB of p53, Lamp2A, and Hsc70 levels in nontargeting (N.T.), Hsc70, or Lamp2A siRNA–transfected ES2 cells treated with AC220 and/or C43 for 24 h. (F) The cellular ATP levels (fold) in ES2 cells treated with AC220 and/or C43 in the presence or absence of zVAD or 7N-1 for 16 h. (G) Cell death indicated as Annexin V/PI positivity (fold) and WB of PARP-1 and caspase-3 cleavage in ES2 cells treated with AC220 and/or C43 in the presence or absence of zVAD or 7N-1 for 24 h. STS was used as a positive cell death inducer. (H) Cell death (fold) of nontargeting (N.T.), Lamp2A, or Hsc70 siRNA–transfected ES2 cells treated with AC220 and/or C43 for 24 h. Anti–α-tubulin was used as a loading control. Cells were treated with 0.1% DMSO (control: vehicle) or 1 µM AC220 and 10 µM C43, unless otherwise stated. In all the experiments, treatment groups were compared with the control group, unless otherwise indicated. Error bars indicate ±SD. *, P < 0.05; **, P < 0.01.
Figure 4.
Figure 4.
Combination treatment of AC220 and spautins induces metabolic catastrophe. (A) The cellular ATP levels (fold) in scramble (SCR), Lamp2A, or Hsc70 siRNA–transfected ES2 cells treated with AC220 and/or C43 for 16 h (C43). WB shows the Hsc70 and Lamp2A siRNA knockdown efficiencies. (B) The intracellular ATP content and ADP/ATP ratio of ES2 cells treated with AC220 and/or C43 for 12 h. (C) Relative change in the NAD+/NADH ratio in lysates from ES2 cells treated with AC220 and/or C43 for 12 h. (D) The rate of mitochondrial respiration measured by OCR in ES2 cells treated with AC220 and/or C43 for 8 h. (E) Relative change in glutamine levels in the culture medium of ES2 cells treated with AC220 and/or C43 (normalized to cell numbers) for 16 h. (F) The cellular ATP levels in ES2 treated with AC220 and/or C43 in the absence or presence of Oligomycin, Rotenone, Etomoxir, or T0070907 for 16 h. (G) ATP-coupled OCR in scramble (SCR), Hsc70, or Lamp2A siRNA–transfected ES2 treated with AC220 and/or C43 for 8 h. Anti–α-tubulin was used as a loading control. Cells were treated with 0.1% DMSO (control: vehicle) or 1 µM AC220 and 10 µM C43, unless otherwise stated. In all the experiments, treatment groups were compared with the control group, unless otherwise shown. Error bars indicate ±SD. *, P < 0.05; **, P < 0.01; ***, P < 0.001.
Figure 5.
Figure 5.
Degradation of HK2 via CMA leads to metabolic stress and cell death. (A) Mutant p53 levels in the cytosolic fraction of ES2 cells treated with AC220 and for 16 h in the absence or presence of MG132. (B) Scatter plot depicting proteins identified and quantified in a quantitative proteomics experiment. Proteins significantly enriched as containing one or more stringent or loose motif biochemically related to KFERQ are highlighted as potential CMA substrates. (C) HK2, SGT1, and FAM3C protein levels in ES2 cells treated with AC220 and C43 up to 24 h. (D) WB analysis of HK2, SGT1, FAM3C, p53, and GAPDH levels in ES2 cells treated with AC220 and C43 for 16 h in the absence or presence of proteasome (MG132) or lysosomal inhibitor (ClQ). This experiment (bottom row) used the same blot as in the bottom row of Fig. 3 C with additional antibodies. (E) Cell viability (%) and cell death (fold) of scramble (SCR) or HK2 siRNA–transfected ES2 cells at 72 h after transfection. (F) The combined ribbon representation and stick model showing the overall structure and the CMA motif of HK2 protein in complex with glucose. The interaction of HK2 with Hsc70 or Lamp2A, after AC220 and/or C43 treatment, was analyzed by coimmunoprecipitation. (G) WB of HK2, p53, and GAPDH levels in ES2 cells transfected with nontargeting (N.T) or Hsc70 siRNA, treated with AC220 and C43 for 12 h. (H) The localization of HK2 in cellular endosomal/mitochondria (EM), lysosomal (L), or cytosolic (C) fractions in ES2 cells treated with AC220 and C43 for 16 h, in the presence of the lysosomal inhibitor (ClQ). Lamp2A, Tom40, or β-actin were used as markers for the fractions. (I) The interaction of wt or Q712A;R713A mutant GFP-HK2 with Hsc70, after AC220 and/or C43 treatment, analyzed in 293T cells by coimmunoprecipitation. (J) WB analysis, cell viability (%), and cell death (fold) of wt and Q712A;R713A mutant GPF-HK2–expressing ES2 cells after AC220 and C43 treatment for 16 h. Anti–α-tubulin was used as a loading control. Cells were treated with 0.1% DMSO (control: vehicle) or 1 µM AC220 and 10 µM C43, unless otherwise stated. In all the experiments, treatment groups were compared with the control group, unless otherwise shown. Error bars indicate ±SD. ***, P < 0.001.

Comment in

References

    1. Aniento F., Roche E., Cuervo A.M., and Knecht E.. 1993. Uptake and degradation of glyceraldehyde-3-phosphate dehydrogenase by rat liver lysosomes. J. Biol. Chem. 268:10463–10470. - PubMed
    1. Correa R.J., Peart T., Valdes Y.R., DiMattia G.E., and Shepherd T.G.. 2012. Modulation of AKT activity is associated with reversible dormancy in ascites-derived epithelial ovarian cancer spheroids. Carcinogenesis. 33:49–58. 10.1093/carcin/bgr241 - DOI - PubMed
    1. Cuervo A.M. 2010. Chaperone-mediated autophagy: selectivity pays off. Trends Endocrinol. Metab. 21:142–150. 10.1016/j.tem.2009.10.003 - DOI - PMC - PubMed
    1. Cuervo A.M., Hu W., Lim B., and Dice J.F.. 1998. IκB is a substrate for a selective pathway of lysosomal proteolysis. Mol. Biol. Cell. 9:1995–2010. 10.1091/mbc.9.8.1995 - DOI - PMC - PubMed
    1. Degterev A., Huang Z., Boyce M., Li Y., Jagtap P., Mizushima N., Cuny G.D., Mitchison T.J., Moskowitz M.A., and Yuan J.. 2005. Chemical inhibitor of nonapoptotic cell death with therapeutic potential for ischemic brain injury. Nat. Chem. Biol. 1:112–119. 10.1038/nchembio711 - DOI - PubMed

Publication types

MeSH terms