. 2015 Aug 31;210(5):753-69.
doi: 10.1083/jcb.201412127.

PI(3,5)P2 controls endosomal branched actin dynamics by regulating cortactin-actin interactions

Affiliations

PI(3,5)P2 controls endosomal branched actin dynamics by regulating cortactin-actin interactions

Nan Hyung Hong et al. J Cell Biol. .

Abstract

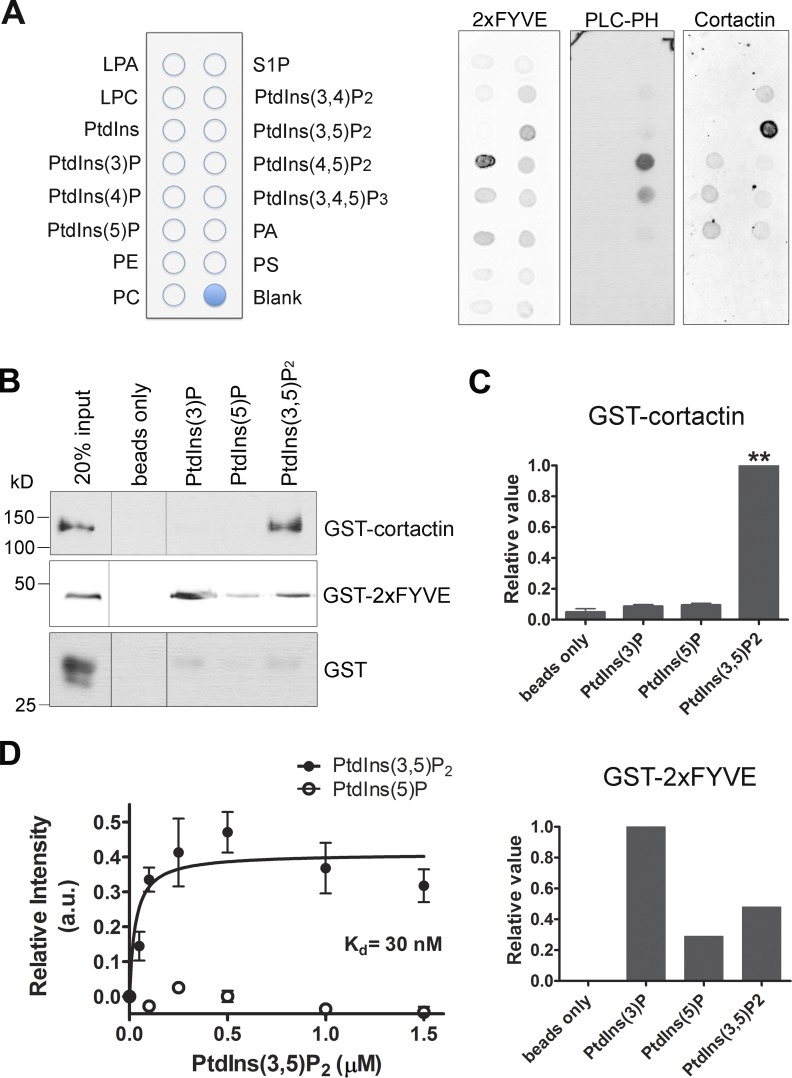
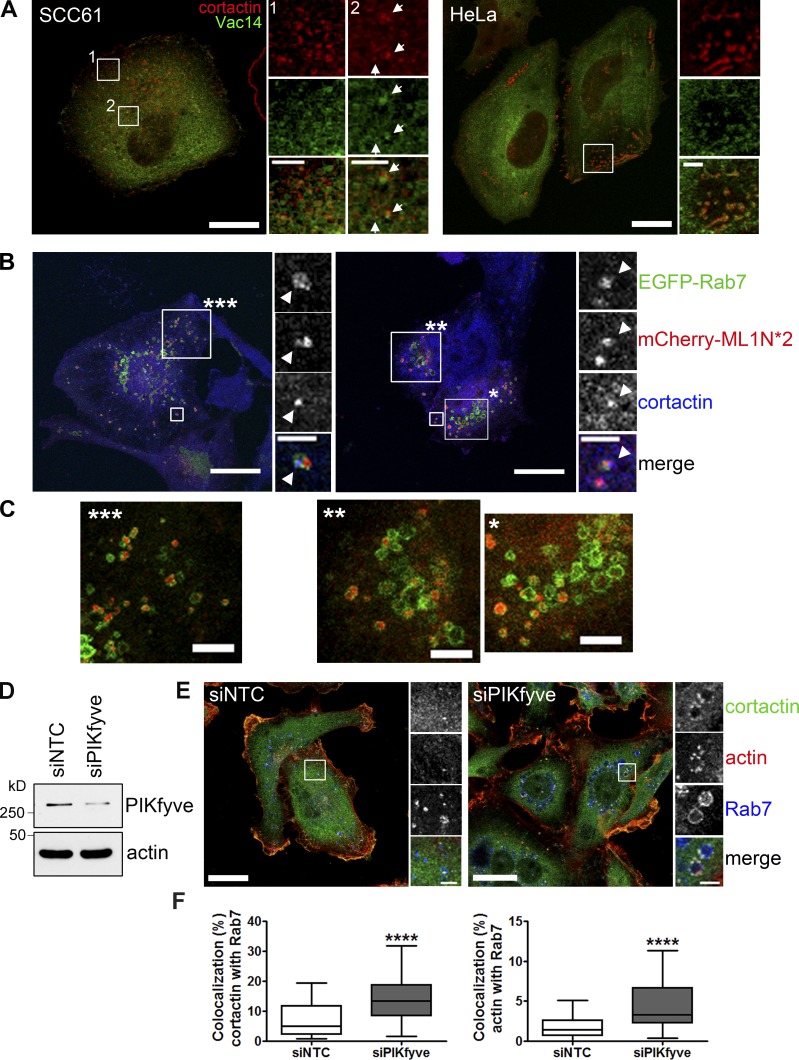
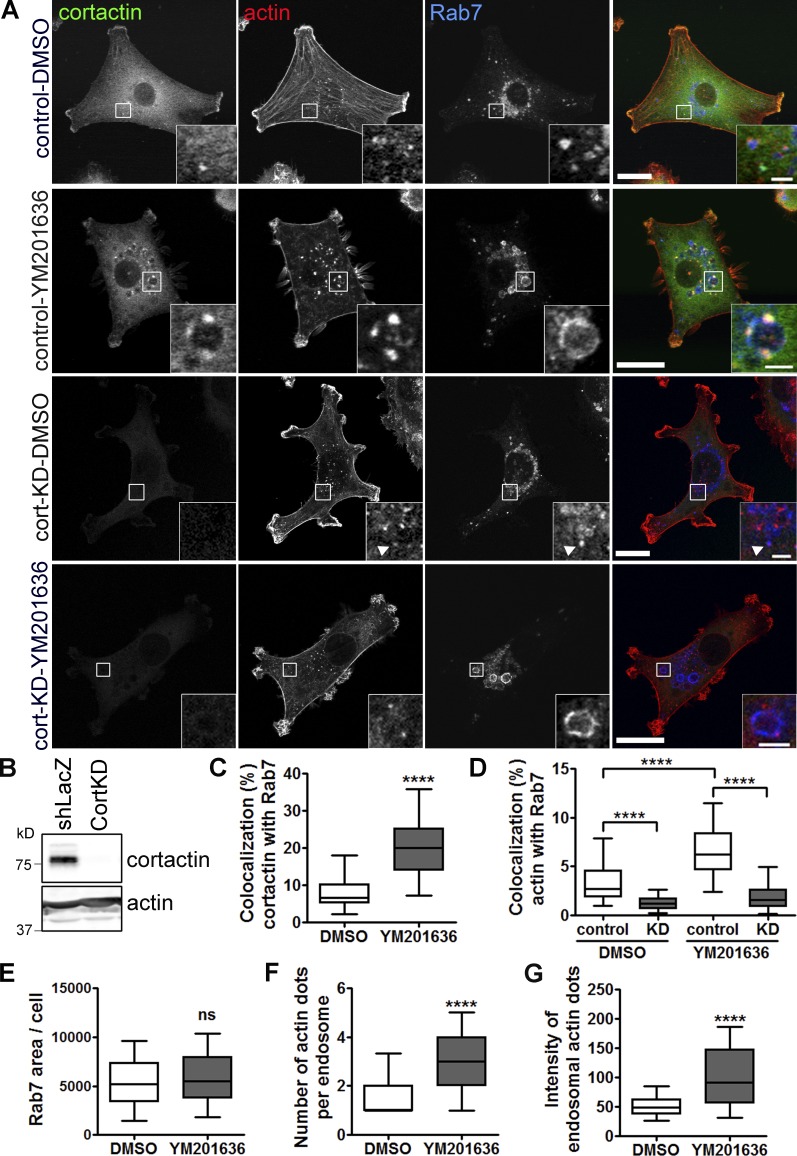
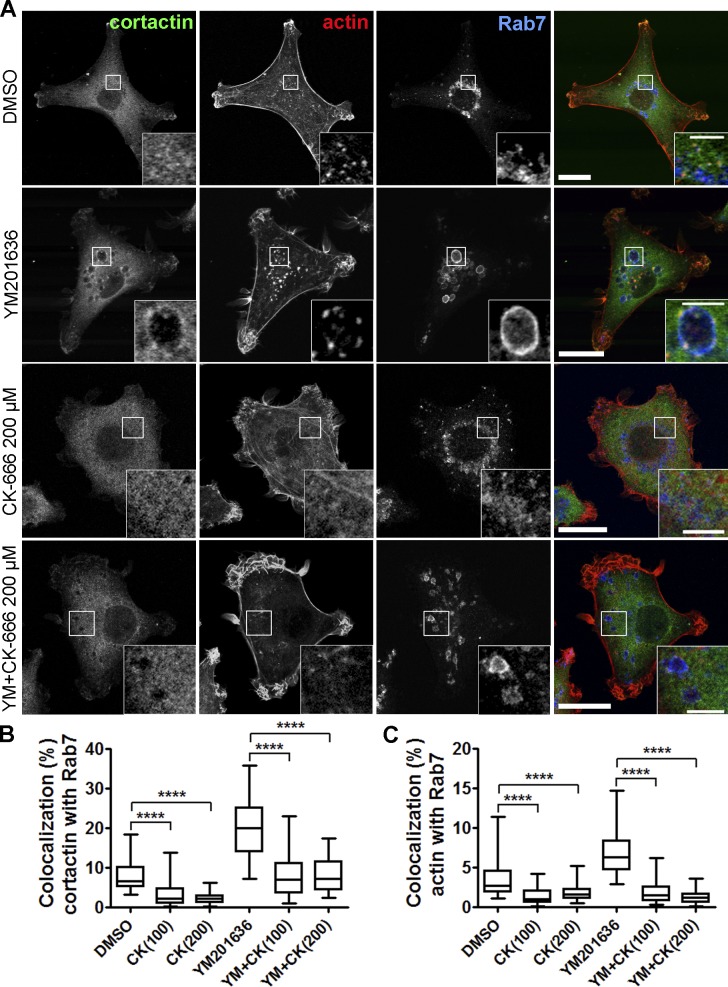
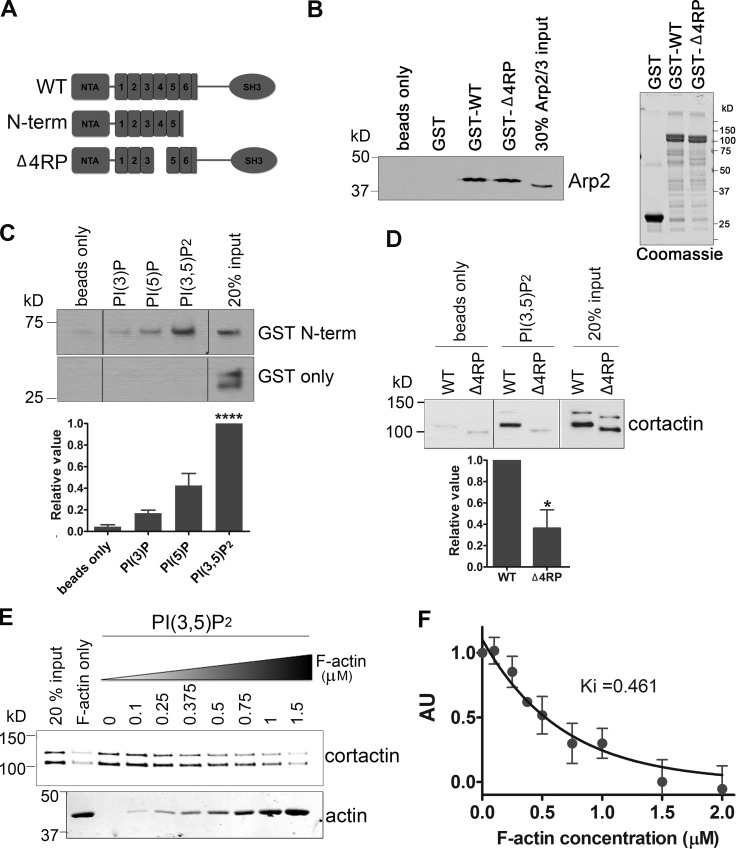
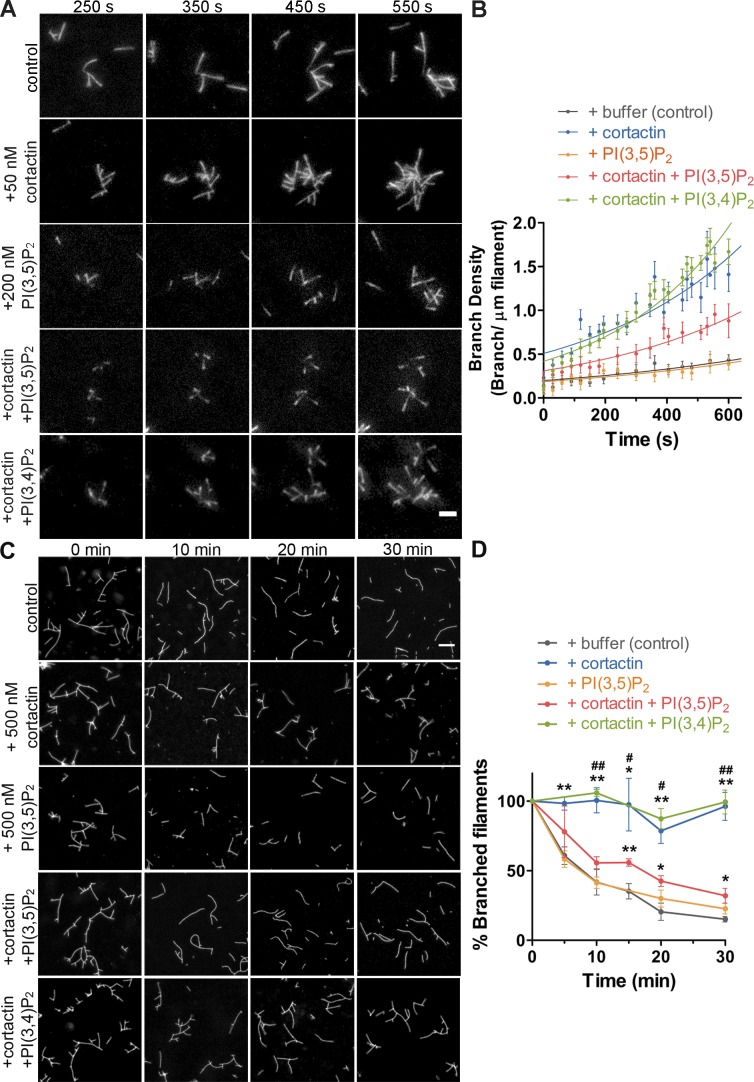
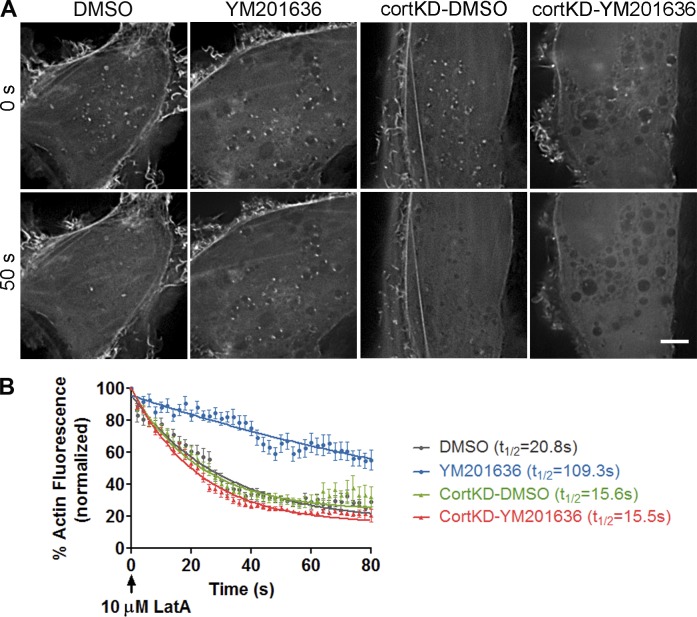
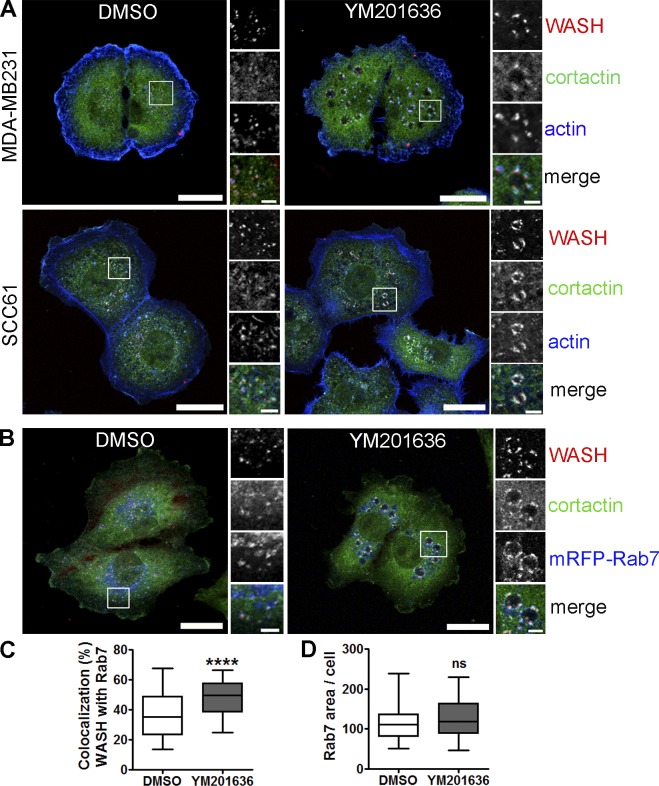
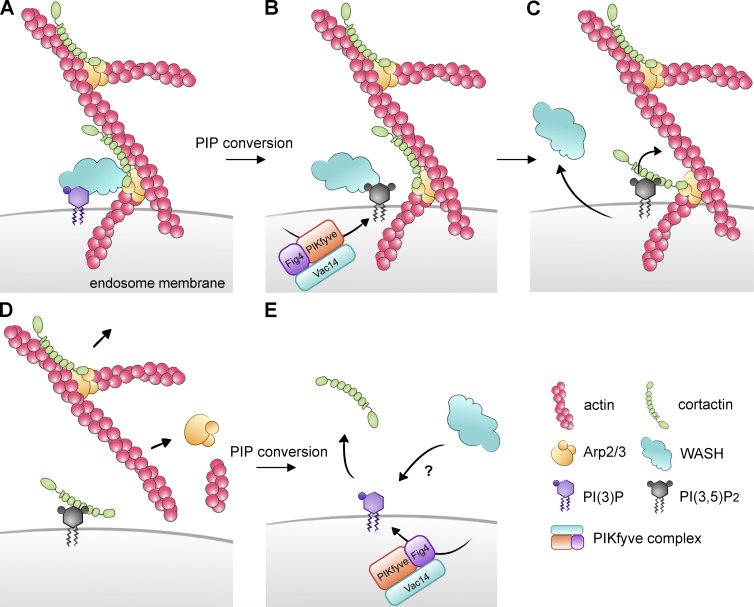
Branched actin critically contributes to membrane trafficking by regulating membrane curvature, dynamics, fission, and transport. However, how actin dynamics are controlled at membranes is poorly understood. Here, we identify the branched actin regulator cortactin as a direct binding partner of phosphatidylinositol 3,5-bisphosphate (PI(3,5)P2) and demonstrate that their interaction promotes turnover of late endosomal actin. In vitro biochemical studies indicated that cortactin binds PI(3,5)P2 via its actin filament-binding region. Furthermore, PI(3,5)P2 competed with actin filaments for binding to cortactin, thereby antagonizing cortactin activity. These findings suggest that PI(3,5)P2 formation on endosomes may remove cortactin from endosome-associated branched actin. Indeed, inhibition of PI(3,5)P2 production led to cortactin accumulation and actin stabilization on Rab7(+) endosomes. Conversely, inhibition of Arp2/3 complex activity greatly reduced cortactin localization to late endosomes. Knockdown of cortactin reversed PI(3,5)P2-inhibitor-induced actin accumulation and stabilization on endosomes. These data suggest a model in which PI(3,5)P2 binding removes cortactin from late endosomal branched actin networks and thereby promotes net actin turnover.


Figures

Figure 1.
Figure 1.
Cortactin directly interacts with PI(3,5)P2. (A) The affinity of full-length cortactin was examined using a protein-lipid overlay assay. The left panel indicates the identity of lipid species on the PIP strip. Cortactin binds most strongly to PI(3,5)P2. Binding of the FYVE domain of Hrs (2xFYVE) and PH domain of PLC-δ1 to PI(3)P and PI(4,5)P2, respectively, served as positive controls. (B) Pull-down of GST–cortactin by liposomes bearing the indicated PIPs. GST-2xFYVE, and GST alone are respectively positive and negative controls. Western blots were probed with anti-GST antibody. (C) The relative binding of GST-fusion proteins to liposomes containing different PIPs was quantified by densitometric analysis of GST immunoblots from three independent experiments, except for positive control GST-2xFYVE that was tested once for pull-down by PI(3)P. Mean ± SE. **, P < 0.01. (D) Cortactin binding PI(3,5)P2- or PI(5)P-containing liposomes, plotted as a function of PIP concentration. Data points in the PI(3,5)P2 and negative control PI(5)P binding curves represent means calculated from data points of five and two different experiments, respectively. The Kd for cortactin–PI(3,5)P2 interaction obtained from nonlinear regression of the data are 30 nM.
Figure 2.
Figure 2.
KD of PIKfyve expression leads to accumulation of cortactin and actin at LE membrane. (A) Representative images of endogenous cortactin (red) localized at discrete subdomains of hVac14-EGFP+ (green) vesicular structures in SCC61 (left) and HeLa (right) cells. Bars: (main panels) 20 µm; (enlarged views) 3 µm. n = 3 independent experiments for each cell line. (B) Representative images of mCherry-ML1N*2 (red) and endogenous cortactin (blue) localization to EGFP-Rab7+ (green) endosomes. Small white boxes are enlarged on the right. Bars, 20 µm (3 µm for magnifications). (C) Magnifications of boxed areas labeled with asterisks in B show colocalization of mCherry-ML1N*2 (red) with EGFP-Rab7 (green). Bars, 5 µm. (D) Immunoblot of PIKfyve expression in PIKfyve-KD MDA-MB-231 cells. NTC, nontargeting control. (E) Immunofluorescence of PIKfyve siRNA-treated cells using antibodies recognizing cortactin (green), actin (red), and Rab7 (blue). Bars, 20 µm (3 µm for magnifications). (F) Percentage of colocalization of cortactin or actin with Rab7. 3 independent experiments, n ≥ 61 cells in each condition. ****, P < 0.0001.
Figure 3.
Figure 3.
Inhibition of PI(3,5)P2 production leads to accumulation of cortactin and actin at LE membrane. (A) Representative images showing cortactin (green) and actin (red) localization on Rab7+ endosomes (blue) after 2-h treatment with 800 nM YM201636 or DMSO diluent control in control and cortactin–KD MDA-MB-231 cells. Bars, 20 µm (3 µm for magnifications). (B) Immunoblot of cortactin expression and β-actin loading control in MDA-MB-231 cells. (C–E) Images were analyzed for percentage of colocalization of cortactin or actin with Rab7 or Rab7 area per cell. 3 independent experiments, n ≥ 55 cells in each condition. (F and G) Number and intensity of actin dots on Rab7+ endosomes. More than 170 vesicles from 12–19 cells analyzed for each condition. Data shown as box and whiskers plots, with the box indicating the 25th and 75th percentiles, solid line indicating the median, and whiskers indicating the 95% confidence intervals. ****, P < 0.0001.
Figure 4.
Figure 4.
Recruitment of cortactin to late endosomes depends on Arp2/3 complex activity. (A) Representative images show cortactin (green), actin (red), and Rab7 (blue) localization after 2 h treatment of MDA-MB-231 cells with 800 nM YM201636 ± 200 µM CK-666. Bars, 20 µm (5 µm for magnifications). (B) Images from cells treated with YM201636 and 100 or 200 µM CK-666 were analyzed for percentage of colocalization of cortactin or actin with Rab7. The DMSO and YM201636 datasets (no CK-666) are the same data as that shown in Fig. 3 ( C and D). Data shown as box and whiskers plots with the box indicating the 25th and 75th percentiles, solid line indicating the median, and whiskers indicating the 95% confidence intervals. 3 independent experiments, n ≥ 50 cells for each condition. ****, P < 0.0001.
Figure 5.
Figure 5.
PI(3,5)P2 regulates the interaction of cortactin with actin filaments. (A) Schematic of WT and mutant cortactin constructs. (B, left) Representative Western blot from n = 3 Arp2/3 binding experiments, probed with an antibody to Arp2. (right) Coomassie-stained gel of GST-tagged proteins immobilized on glutathione beads used in Arp2/3 binding experiment. The same amount of beads was loaded in each lane and used in the experiment. (C and D) Representative Western blots from (C) GST-N-term and (D) GST-Δ4RP cortactin–pull-down experiments. Cortactin proteins bound to PI(3,5)P2-liposomes were identified with an anti-GST antibody. Relative binding affinity was quantified by densitometric analysis of Western blot data from three independent experiments. Mean ± SE. *, P < 0.05; ****, P < 0.0001. (E and F) F-actin competes with PI(3,5)P2 for binding to cortactin. (E) Increasing concentrations of actin filaments were incubated with 70 nM cortactin and 250 nM PI(3,5)P2-containing liposomes. In the presence of F-actin, cortactin binding to liposomes was significantly reduced. (F) Data points show mean binding from four independent experiments. Fit to hyperbolic decay model yields a Ki value of 0.461 µM.
Figure 6.
Figure 6.
PI(3,5)P2 antagonizes the activity of cortactin in branched actin regulation. (A and B) Synergistic activation of actin branching. (A) TIRF microscopy images of reactions containing actin (0.75 µM 33% Oregon Green labeled), 10 nM Arp2/3 complex, 50 nM GST-VCA, and the indicated amounts of cortactin and PI(3,5)P2- or PI(3,4)P2-liposomes. Bar, 3 µm. (B) Branch density plotted as a function of time. Error bars = SEM for ≥3 independent experiments. Branch density of cortactin + PI(3,5)P2-liposomes was significantly decreased (P < 0.05) as compared with that of the +cortactin only condition for each time point after 150 s, except for the 390- and 450-s time points. (C) and (D) Debranching. (C) Representative images of actin debranching over time. 3 µM G-actin was polymerized in the presence of 100 nM Arp2/3 and 600 nM GST-VCA for 8 min. At that time, buffer, 500 nM cortactin, 500 nM PI(3,5)P2, 500 nM cortactin + 500 nM PI(3,5)P2-liposomes, or 500 nM cortactin + 500 nM PI(3,4)P2-liposomes were added to individual reactions. Samples were incubated for an additional minute, as indicated, before the debranching reactions were stopped with 3 µM rhodamine-phalloidin and visualized. Bar, 3 µm. (D) Data points show percent branched filaments per field, calculated from three or four independent experiments. Error bars = SEM. * or #, P < 0.05; ** or ##, P < 0.01. Asterisks compare cortactin versus +buffer control and the # symbol compares +cortactin versus +cortactin + PI(3,5)P2 condition.
Figure 7.
Figure 7.
Actin stability on endosomal membrane is controlled by PI(3,5)P2. MDA-MB-231 cells stably expressing mGFP-F-tractin were treated with DMSO or YM201636 for 2 h, and then imaged live after treatment with 10 µM latrunculin A (LatA). (A) Representative images at 0 and 50 s after LatA treatment. Bar, 5 µm. (B) The change in endosomal actin fluorescence over time after LatA treatment was normalized to initial endosomal actin fluorescence. n = 10–15 cells from 3 independent experiments for each condition.
Figure 8.
Figure 8.
WASH localization is controlled by PI(3,5)P2 levels. (A) Representative images from MDA-MB-231 (top) and SCC61 (bottom) showing localization of WASH (red), cortactin (green), and actin (blue) after 2-h treatment with 800 nM YM201636 or DMSO diluent control. Bars, 20 µm. (B) Representative images of MDA-MB-231 cells stably expressing mRFP-Rab7 (pseudocolored blue) immunostained by WASH (red) and cortactin (green) after 2-h treatment with 800 nM YM201636 or DMS0 diluent control. Bars, 20 µm (5 µm for magnifications). (C and D) Images were analyzed for percentage of colocalization of WASH with Rab7 (C) and Rab7 area/cell (D). 2 independent experiments, n ≥ 62 cells in each condition. ****, P < 0.0001.
Figure 9.
Figure 9.
Model of endosomal branched actin network regulation by PI(3,5)P2. (A) Branched actin nucleation is initiated by the WASH complex which is bound to the surface of late endosomes by signaling molecules that likely include PI(3)P (Jia et al., 2010). WASH-induced activation of the Arp2/3 complex recruits cortactin to nascent branch points (Fig. 4), where it synergistically promotes actin assembly. (B) Conversion of PI(3)P to PI(3,5)P2 is accomplished by the enzymatic activity of PIKfyve within the three-member PIKfyve complex that includes the scaffold protein Vac14 and the opposing 5′ phosphatase Fig. 4 (Shisheva, 2008; Dove et al., 2009). (C) PI(3,5)P2 binds to cortactin, releasing actin filaments (Fig. 5) and potentially the WASH complex from endosomes (Fig. 8). (D) Without cortactin binding to the branchpoint, Arp2/3 complex loses affinity for the mother filament (Uruno et al., 2001) causing debranching (Weaver et al., 2001; Fig. 6). Disassembly of branched actin networks leads to diminished recruitment of cortactin. (E) Conversion of PI(3,5)P2 back to PI(3)P should release cortactin from the endosome surface unless new branched actin networks are available for rebinding. Interconversion of PI(3)P and PI(3,5)P2 by the PIKfyve complex may facilitate dynamic cycling of actin assembly and disassembly through control of cortactin–actin interactions.

Similar articles

Cited by

References

    1. Behnia R., and Munro S.. 2005. Organelle identity and the signposts for membrane traffic. Nature. 438:597–604. 10.1038/nature04397 - DOI - PubMed
    1. Bird I.M. 1994. Analysis of cellular phosphoinositides and phosphoinositols by extraction and simple analytical procedures. Methods Mol. Biol. 27:227–248. - PubMed
    1. Bolino A., Muglia M., Conforti F.L., LeGuern E., Salih M.A., Georgiou D.M., Christodoulou K., Hausmanowa-Petrusewicz I., Mandich P., Schenone A., et al. . 2000. Charcot-Marie-Tooth type 4B is caused by mutations in the gene encoding myotubularin-related protein-2. Nat. Genet. 25:17–19. 10.1038/75542 - DOI - PubMed
    1. Bryce N.S., Clark E.S., Leysath J.L., Currie J.D., Webb D.J., and Weaver A.M.. 2005. Cortactin promotes cell motility by enhancing lamellipodial persistence. Curr. Biol. 15:1276–1285. 10.1016/j.cub.2005.06.043 - DOI - PubMed
    1. Cai L., Makhov A.M., Schafer D.A., and Bear J.E.. 2008. Coronin 1B antagonizes cortactin and remodels Arp2/3-containing actin branches in lamellipodia. Cell. 134:828–842. 10.1016/j.cell.2008.06.054 - DOI - PMC - PubMed

Publication types

MeSH terms

Substances