. 2015 Aug 31;210(5):785-800.
doi: 10.1083/jcb.201412030.

Annexin A2-dependent actin bundling promotes secretory granule docking to the plasma membrane and exocytosis

Affiliations

Annexin A2-dependent actin bundling promotes secretory granule docking to the plasma membrane and exocytosis

Marion Gabel et al. J Cell Biol. .

Abstract

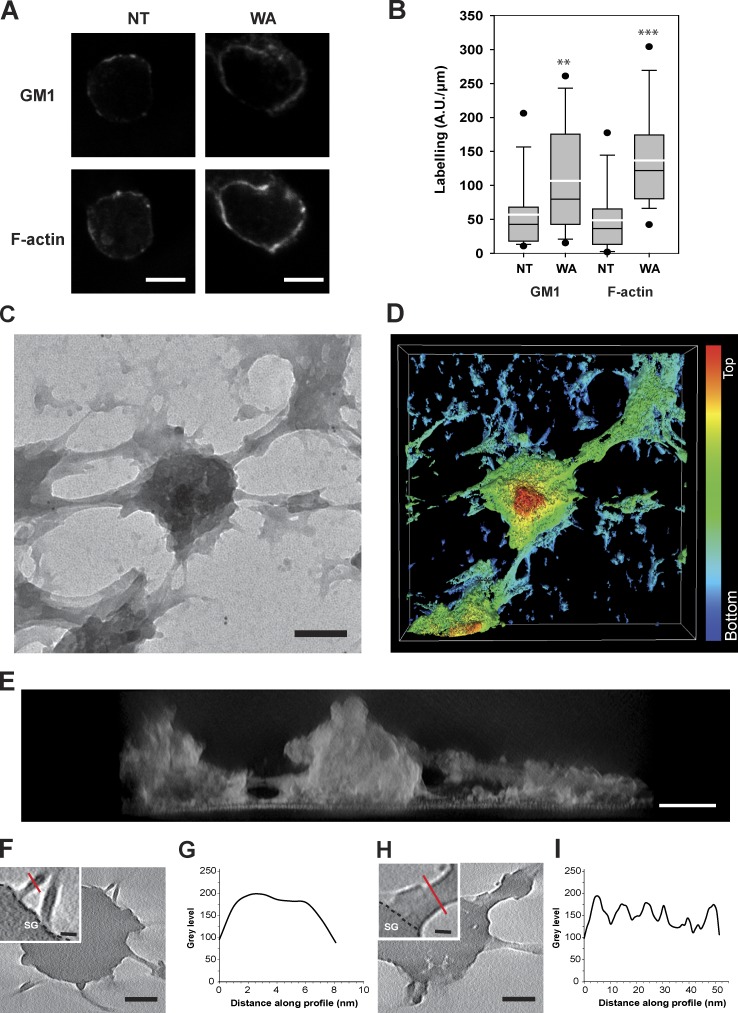
Annexin A2, a calcium-, actin-, and lipid-binding protein involved in exocytosis, mediates the formation of lipid microdomains required for the structural and spatial organization of fusion sites at the plasma membrane. To understand how annexin A2 promotes this membrane remodeling, the involvement of cortical actin filaments in lipid domain organization was investigated. 3D electron tomography showed that cortical actin bundled by annexin A2 connected docked secretory granules to the plasma membrane and contributed to the formation of GM1-enriched lipid microdomains at the exocytotic sites in chromaffin cells. When an annexin A2 mutant with impaired actin filament-bundling activity was expressed, the formation of plasma membrane lipid microdomains and the number of exocytotic events were decreased and the fusion kinetics were slower, whereas the pharmacological activation of the intrinsic actin-bundling activity of endogenous annexin A2 had the opposite effects. Thus, annexin A2-induced actin bundling is apparently essential for generating active exocytotic sites.


Figures

Figure 1.
Figure 1.
F-actin and GM1 colocalize in microdomains formed at exocytotic sites. (A) Chromaffin cells were unstimulated (U) or stimulated for 10 min with nicotine (S) in the presence of anti-DBH antibodies and Alexa Fluor 633–conjugated cholera toxin. Cells were then fixed and labeled with TRITC-phalloidin and Alexa Fluor 488–conjugated anti–rabbit antibodies to reveal DBH staining. Merged images were recorded in the same optical section. Bars, 10 µm. Masks representing the colocalization area (phalloidin/cholera toxin or phalloidin/DBH) were generated by selecting the double-labeled pixels. (B) Semiquantitative analysis of the percentage of F-actin colocalized with GM1 and exocytotic sites. Asterisks indicate statistical significance (***, P < 0.001) for medians (black line) determined using a Mann-Whitney test and the white line represents the mean (±SEM; n = 20). Similar results were obtained on two culture preparations. (C) Distribution of GM1 and actin on plasma membrane sheets visualized by immunogold labeling and electron microscopy. Membrane sheets were prepared from untreated cells or cells stimulated with 20 µM nicotine in the presence of biotinylated cholera toxin to detect external GM1. Cells were treated with 50 µM latrunculin B where indicated. Membranes were then incubated with anti-actin antibodies revealed with anti–rabbit antibodies coupled to 10 nm gold particles and streptavidin coupled to 6 nm gold particles to reveal cholera toxin/GM1. Bars, 100 nm. (D) Histogram representing the relative distribution of 6 nm and 10 nm gold particles according to their distance from a granule (error bars indicate ±SEM; n = 40 images). The distance and number of particles were determined manually. Note that GM1-bound particles and actin-bound particles are concentrated within 0.1 µm from the granule edge. A significant number of actin-bound particles were located on the granules (<25 nm away). (E) Bivariate K-function analysis of double-labeled membranes. Images obtained in unstimulated (15) and nicotine-stimulated (20) cells were analyzed. Values of L(r)-r greater than the 95% CI indicated the significant coclustering of actin and GM1. (F) Spatial point pattern analysis of GM1 labeling. For each condition, 30 images were analyzed and experiments were performed on two different cell cultures. Values of L(r)-r greater than the 95% CI indicated significant GM1 clustering in nicotine-stimulated cells, whereas a random pattern was seen in untreated cells and nicotine-stimulated cells treated with latrunculin B.
Figure 2.
Figure 2.
Electron tomography of the cortical actin network surrounding secretory granules docked at the plasma membrane. (A) Electron micrograph showing a plasma membrane prepared from a nicotine-stimulated cell. Secretory granules docked at the plasma membrane were surrounded by a filamentous network. (B) A 3D model of the granule in A showing the close interaction between docked secretory granules and the cortical F-actin network covering the inner face of the plasma membrane. False colors were applied using a color code related to the topographic height (shown on the right), with the plasma membrane sheets as the lowest plane (Video 1). (C–H) Series of tomographic slices of the docked granule in A. The first (Top) and last sections (Bottom) correspond, respectively, to the farthest and closest parts of the docking region of secretory granules at the plasma membrane. Actin colloidal gold immunostaining (arrows) served as a fiducial marker for image alignment during tomographic reconstruction. The inset in E is a 2.5× enlargement of the granule whose limit is shown as a broken black line. The asterisks indicate the protrusions that correspond to anchored F-actin. SG, secretory granule. (I) Surface-rendered view of a subtomogram corresponding to an equatorial section of the granule shown in A. The 3D representation is associated with the three tomographic sections (left) showing different branched anchoring structures that are connected to the granule. (J) Surface-rendered view of a subtomogram corresponding to a longitudinal section of the granule shown in A. The volume eraser tool in UCSF Chimera was used to perform curettage inside the granule until reaching the membrane. The topography of the granule surface is displayed in purple. The excess removed by curettage is shown in green. The path followed by the actin filaments is represented by the broken yellow lines. Bars: (A) 200 nm; (C) 100 nm; (E, inset) 25 nm; (I and J) 25 nm.
Figure 3.
Figure 3.
Spatial organization of actin filaments connecting secretory granules to the plasma membrane. (A) TEM images at zero tilt of a docked secretory granule and a series of secretory granules at different stages of fusion (left) and the corresponding clipping plane of the side view of the isosurface representation of their tomogram (right). Actin cytoskeleton favoring exocytosis (asterisks) of secretory granules (SG) is clearly linked to the plasma membrane (PM) through specific associated-membrane structures (V). Bars, 200 nm. (B) Slices through a tomogram of docked and fusing secretory granules. Red broken circles define an area of 90–250 nm around the granules, wherein anchor points for cortical actin at the plasma membrane were systematically localized. Bars, 100 nm.
Figure 4.
Figure 4.
GM1-enriched domains formed at the plasma membrane in nicotine-stimulated cells contain the AnxA2 tetramer, actin filaments, and SNARE proteins. (A and B) Double staining of AnxA2 (10 nm gold particles) and phalloidin (6 nm gold particles) on plasma membrane sheets prepared from unstimulated (A) and nicotine-stimulated cells (B). The right panel in B shows a higher magnification of the region delimited by the rectangle. Note that AnxA2 is also present on the docked granule surface (arrowhead). (C) Bivariate K-function analysis of double-labeled membranes (n = 44 images). Values of L(r)-r greater than the 95% CI indicated the significant colocalization of F-actin and AnxA2 in nicotine-stimulated chromaffin cells. (D) Spatial distribution of GM1 (6 nm gold particles, squares) and actin (10 nm gold particles) on the plasma membrane from a nicotine-stimulated cell. (E and F) Plasma membrane sheets from nicotine-stimulated cells stained for either GM1 (6 nm gold particles, squares)/S100A10 (10 nm gold particles, circles)/AnxA2 (15 nm gold particles) or GM1 (6 nm gold particles, squares)/actin (15 nm gold particles)/syntaxin (10 nm gold particles, circles). Bars, 100 nm.
Figure 5.
Figure 5.
The actin-bundling activity of AnxA2 is linked to the formation of GM1-enriched domains in stimulated cells. (A) F-actin binding assay of recombinant GST-AnxA2 WT and GST-AnxA2 K286A in the absence and presence of calcium. Purified recombinant AnxA2 proteins fused with GST (4 µM) were incubated with preformed actin filaments (18 µM) for 30 min at room temperature. After low-speed centrifugation, the supernatant (S) and pellet (P) were collected and separated on a 4–20% SDS-PAGE-gel. (B) Electron microscopic visualization of recombinant AnxA2/F-actin aggregates. Before centrifugation, a 5-µl aliquot was spread on electron grids and prepared for electron microscopy. The inset shows a higher magnification of the region delimited by the square. (C) Cells expressing AnxA2-WT-GFP or AnxA2-K286A-GFP were stimulated with 59 mM K+ in the presence of fluorescent cholera toxin to visualize GM1-enriched domains, then fixed and stained with TRITC-phalloidin. Confocal images were recorded in the same optical section. Asterisks indicate nontransfected cells. (D) Semiquantitative analysis of cholera toxin (GM1) and F-actin labeling in nicotine-stimulated cells expressed in arbitrary units (±SEM; n = 20). Statistical significance for medians (black line) was determined using a Mann-Whitney test. Asterisks indicate statistical significance (*, P < 0.05; ***, P < 0.001) and the white lines represent the means. Similar results were obtained on three culture preparations. Bars: (B, main panels) 500 nm; (B, inset) 100 nm; (C) 10 µm.
Figure 6.
Figure 6.
WA stimulates the formation of GM1-enriched domains and thickens actin bundles connecting secretory granules to the plasma membrane in nicotine-stimulated cells. (A) Confocal micrographs of cells treated for 1 h with 3 µM WA and stimulated with 10 µM nicotine in the presence of cholera toxin. Cells were then fixed and labeled with rhodamine-conjugated phalloidin to visualize F-actin. (B) Semiquantitative analysis of cholera toxin and F-actin labeling expressed in arbitrary units (±SEM; n = 15). Statistical significance for medians (black line) was determined using a Mann-Whitney test. The asterisks indicate statistical significance (**, P < 0.01; ***, P < 0.001) and the white lines represent the means. Similar results were obtained in two independent experiments performed on two culture preparations. (C) Electron micrographs of plasma membrane sheets prepared from nicotine-stimulated and WA-treated cells labeled with anti-actin antibodies and immunogold. (D) 3D model of the same secretory granule showing the bundling effect of WA on the actin network anchored to the granule surface. False colors were applied using a color-coded surface related to the topographic height on the right (Video 2). (E) Clipping plane of the side view of the isosurface representation of a tomogram showing an increase in the actin network anchored to the granule surface in a WA-treated cell. (F–I) Central tomographic section of a docked secretory granule and corresponding enlargement (inset, 2.5× zoom) showing anchored actin filaments and the granule surface marked with a dotted black line. Graphs (G and I) represent a plot profile along the red line perpendicular to the actin filament. Images were obtained from control (F) and WA-treated (H) cells stimulated with nicotine. Plot profiles presented are representative of several measurements (n = 15 for each plot profile) from different tomograms (n = 3 for each conditions). Individual 10-nm actin filaments anchored granules in control cells, whereas large actin bundles consisting of at least five actin filaments were observed in WA-treated cells. Bars: (A) 5 µm; (C) 200 nm; (E, F and H, main panels) 100 nm; (F and H, insets) 25 nm.
Figure 7.
Figure 7.
The actin-bundling activity of AnxA2 is involved in granule recruitment and fusion. Chromaffin cells were stimulated with a local application of 100 mM KCl for 10 s, and catecholamine secretion was monitored using carbon fiber amperometry. Control release was measured in nontransfected cells from the same culture dish. (A) Typical amperometric recordings obtained in nontransfected cells (NT), cells expressing AnxA2-K286A-GFP, and cells treated for 1 h with 5 µM WA. (B) The number of amperometric spikes per cell recorded in nontransfected cells (NT), cells transfected with AnxA2-WT-GFP (A2-WT) or AnxA2-K286A-GFP (A2-K286A), or WA-treated cells (NT+WA). Results represent the mean ± SD (error bars) from 25–55 cells. (C) Schema showing the different spike parameters of the amperometric response (means ± SEM) measured in D. *, P < 0.05; **, P < 0.01.
Figure 8.
Figure 8.
The actin-bundling activity of AnxA2 modulates the formation of the initial fusion pore. (A) Schema showing the parameters of the PSF signal measured in B, C, and D panels. NT, nontransfected cells; A2-WT, cells transfected with AnxA2-GFP WT; A2-K286A, cells transfected with AnxA2-K286A-GFP; NT + WA, cells treated for 1 h with 5 µM WA. Data are expressed as mean ± SEM (error bars). *, P < 0.05; **, P < 0.01.
Figure 9.
Figure 9.
AnxA2 forms the actin bundles that anchor the secretory granules at the plasma membrane during exocytosis. (A) Electron micrograph plasma membrane sheets prepared from unstimulated or stimulated cells transfected with AnxA2-WT-GFP (A2-WT) or AnxA2-K286A-GFP (A2-K286A), or nontransfected cells treated with WA (NT+WA). Transfected cells were labeled with anti-GFP antibodies revealed with 25 nm gold particles. Bars, 500 nm. (B) TEM image at zero tilt of a secretory granule docked on the plasma membrane of a cell transfected with AnxA2-K286A-GFP (left) and the clipping plane of the side view of the isosurface representation of the tomogram (right). Bars, 200 nm. (C) The number of granules morphologically docked on plasma membrane sheets of unstimulated (U) and stimulated (S) cells, nontransfected cells (NT), cells transfected with AnxA2-WT-GFP (A2-WT) or AnxA2-K286A-GFP (A2-K286A), or cells treated with WA (NT+WA). Results indicate ±SEM from 25–50 images. Asterisks indicate statistical significance (***, P < 0.001) for medians (black line) determined using a Mann-Whitney test, the white lines represent the means. Images were acquired from three different culture preparations.

Similar articles

Cited by

References

    1. Ammar M.R., Kassas N., Chasserot-Golaz S., Bader M.F., and Vitale N.. 2013. Lipids in regulated exocytosis: What are they doing? Front. Endocrinol. (Lausanne). 4:125. - PMC - PubMed
    1. Aoyagi K., Sugaya T., Umeda M., Yamamoto S., Terakawa S., and Takahashi M.. 2005. The activation of exocytotic sites by the formation of phosphatidylinositol 4,5-bisphosphate microdomains at syntaxin clusters. J. Biol. Chem. 280:17346–17352. 10.1074/jbc.M413307200 - DOI - PubMed
    1. Astro V., and de Curtis I.. 2015. Plasma membrane-associated platforms: dynamic scaffolds that organize membrane-associated events. Sci. Signal. 8:re1 10.1126/scisignal.aaa3312 - DOI - PubMed
    1. Bader M.F., Trifaró J.M., Langley O.K., Thiersé D., and Aunis D.. 1986. Secretory cell actin-binding proteins: identification of a gelsolin-like protein in chromaffin cells. J. Cell Biol. 102:636–646. 10.1083/jcb.102.2.636 - DOI - PMC - PubMed
    1. Berberian K., Torres A.J., Fang Q., Kisler K., and Lindau M.. 2009. F-actin and myosin II accelerate catecholamine release from chromaffin granules. J. Neurosci. 29:863–870. 10.1523/JNEUROSCI.2818-08.2009 - DOI - PMC - PubMed

Publication types

LinkOut - more resources