. 2015 Nov;35(22):3841-53.
doi: 10.1128/MCB.00677-15. Epub 2015 Aug 31.

Spatial Interplay between Polycomb and Trithorax Complexes Controls Transcriptional Activity in T Lymphocytes

Affiliations

Spatial Interplay between Polycomb and Trithorax Complexes Controls Transcriptional Activity in T Lymphocytes

Atsushi Onodera et al. Mol Cell Biol. 2015 Nov.

Abstract

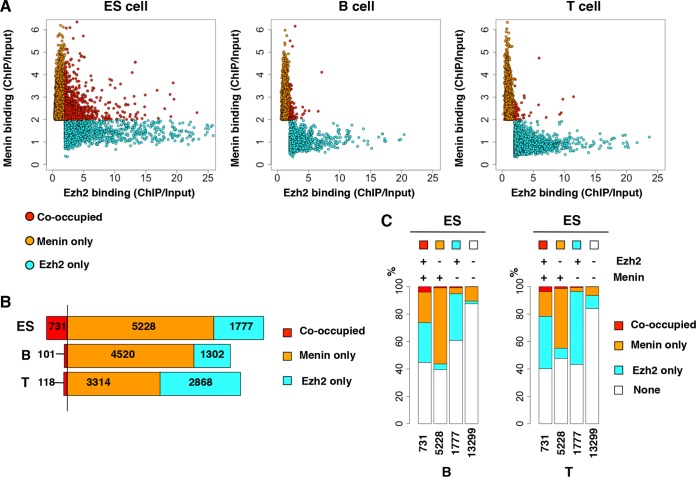
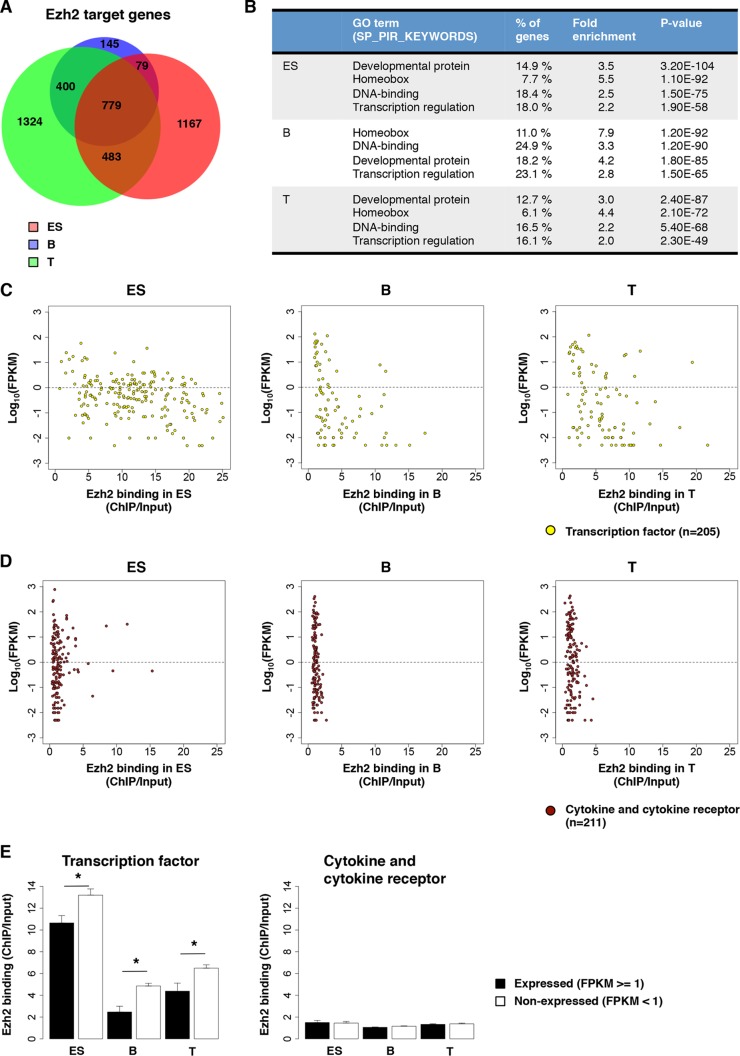
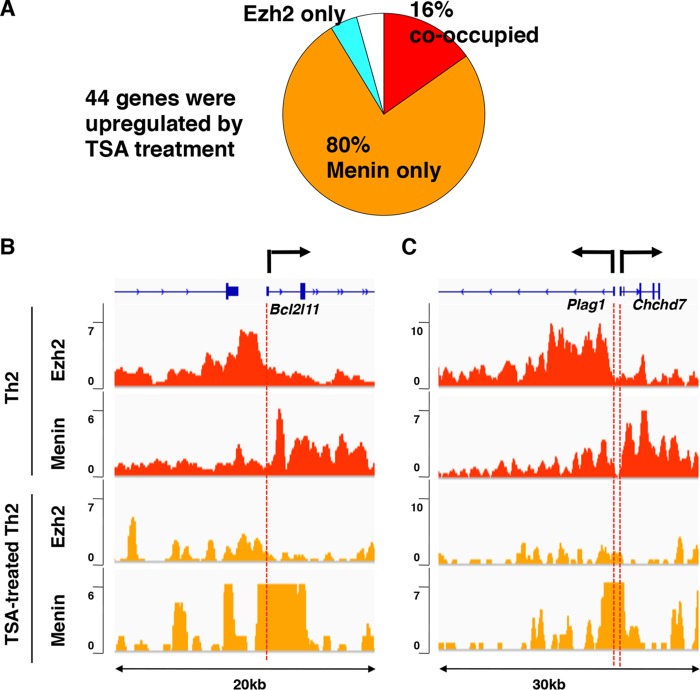
Trithorax group (TrxG) and Polycomb group (PcG) proteins are two mutually antagonistic chromatin modifying complexes, however, how they together mediate transcriptional counter-regulation remains unknown. Genome-wide analysis revealed that binding of Ezh2 and menin, central members of the PcG and TrxG complexes, respectively, were reciprocally correlated. Moreover, we identified a developmental change in the positioning of Ezh2 and menin in differentiated T lymphocytes compared to embryonic stem cells. Ezh2-binding upstream and menin-binding downstream of the transcription start site was frequently found at genes with higher transcriptional levels, and Ezh2-binding downstream and menin-binding upstream was found at genes with lower expression in T lymphocytes. Interestingly, of the Ezh2 and menin cooccupied genes, those exhibiting occupancy at the same position displayed greatly enhanced sensitivity to loss of Ezh2. Finally, we also found that different combinations of Ezh2 and menin occupancy were associated with expression of specific functional gene groups important for T cell development. Therefore, spatial cooperative gene regulation by the PcG and TrxG complexes may represent a novel mechanism regulating the transcriptional identity of differentiated cells.


Figures

FIG 1
FIG 1
Genome-wide comparison of Ezh2-menin cooccupancy between ES cells and lymphocytes. (A) Comparison of Ezh2 and menin binding in ES cells (left), B cells (middle), and T cells (right). Of all target genes shown in panel B, genes with >2-fold enrichment (ChIP/Input DNA) in Ezh2 and/or menin binding were used for the depiction. (B) Bar graph indicating the frequency of Ezh2 and menin cooccupancy and mono-occupancy. (C) Cooccupied, mono-occupied, and unbound gene groups in ES cells are compared for relative percentages of Ezh2 and menin occupancy in B cells (left) and T cells (right). Ezh2 and menin binding states at the ES cell stage are shown above the bars.
FIG 2
FIG 2
Conserved signatures of PcG occupancy between ES cells and lymphocytes. (A) A Venn diagram shows the numbers of cell-type-specific and non-cell-type-specific Ezh2 target genes. (B) GO categories overrepresented in Ezh2-positive gene sets in ES, B, and T cells. (C and D) mRNA levels are plotted against levels of Ezh2 binding at 205 genes encoding transcription factors that are identified as PcG quadruple-positive genes in ES cells (6) (C) or at 211 cytokine and cytokine receptor genes (D). (E) The mean levels of Ezh2 binding at the expressed and nonexpressed genes are shown. Error bars indicate the standard errors of mean. P values were calculated by the Welch two-sample t test (*, P < 0.05).
FIG 3
FIG 3
ChIP-Seq binding profiles reveal a novel feature of cooccupancy with Ezh2 and menin. (A) Compiled tag density profiles (upper) and heat map representation of binding profiles (lower) across the TSS from the kb −5 and kb +3 flanking regions with 100-bp resolution for Ezh2. The heat map is rank ordered from genes with the highest UD indices to the lowest UD indices. (B) Correlation matrix shows Pearson correlations of UD indices between indicated data sets. Dark and light pink, positive correlation; white, no correlation; light blue, negative correlation. (C) Comparison of UD indices of Ezh2 to those of menin at cooccupied genes. Scatter plots compare Ezh2 UD indices against menin UD indices in ES, B, and T cells. Sectors are demarcated by lines along which the subtraction of the menin UD index from the Ezh2 UD index yields values of ±0.25. (D) Comparison of UD indices of Ezh2 and menin at cooccupied genes defined by MACS peak calling. The cooccupied genes were rank ordered by MACS peak length, and rank-dependent changes in correlation coefficient between Ezh2 UD indices and menin UD indices were examined (see also Materials and Methods). The x axis indicates the number of analyzed genes (e.g., “x = 100” means that top 100 cooccupied genes are used for calculating correlation coefficient indicated in the y axis). P values were calculated by testing for no correlation (*, P < 0.05). (E) Scatter plots compare Ezh2 UD indices against menin UD indices in Th2 cells (left). Red dots indicate genes with increased expression (4-fold) in Ezh2-deficient Th2 cells, and blue dots indicate genes with decreased expression (4-fold) in Ezh2-deficient Th2 cells compared to wild-type Th2 cells. Sectors are demarcated as for panel C. The ratios of the number of genes in the central sector to that in the peripheral sectors are shown on the right.
FIG 4
FIG 4
Comparison of mRNA levels with positions of Ezh2/menin binding. (A and B) The DNA microarray signal intensity in ES (A) and T (B) cells is plotted against values resulting from the subtraction of the menin UD index from the Ezh2 UD index. The maximum Affymetrix-GeneChip probe data corresponding to each RefSeq gene was used for scatter plots. All dots corresponding to the genes shown in Fig. 5A to F and Fig. S6J and K in the supplemental material are highlighted. (C and D) Comparison of mRNA levels with positions of Ezh2/menin binding at cooccupied genes defined by MACS peak calling. The cooccupied genes were rank ordered by MACS peak length, and rank-dependent changes in correlation coefficients between mRNA levels (after being log10 transformed) and the subtraction of the menin UD index from the Ezh2 UD index were examined. P values were calculated by testing for no correlation (*, P < 0.05).
FIG 5
FIG 5
Ezh2 and menin binding profiles at genes showing examples of cooccupancy in ES or T cells. Binding of Ezh2, Dpy30, and menin and modifications of histone H3K27me3 and H3K4me3 at representative loci in ES cells (pink) and T cells (green) are shown. ChIP-Seq profiles are shown across six loci (chromosome 10, 111650000 to 111750000 [A]; chromosome 5, 46000000 to 46050000 [B]; chromosome 1, 120900000 to 121000000 [C]; chromosome 4, 6873211 to 6950000 [D]; chromosome 2, 9750000 to 9850000 [E]; chromosome 7, 99850000 to 99950000 [F]). Ezh2Ref (GSE23943), Dpy30 (GSE26136), and histone modification (GSE23943) data sets were obtained from the GEO database. For the visualization of binding, data sets from GSE23943 underwent the same data processing as the data sets of the present study, as described in Materials and Methods. The data sets from GSE26136 were used without data processing. The Gata3 gene showed a low UD index for Ezh2 and a high UD index for menin in T cells (Ezh2, 0.109; menin, 0.501) and was highly transcribed (E) (Fig. 4B). The binding region of Ezh2 and menin around the Gata3 TSS region does not overlap, an observation consistent with our previous findings (14). The Rab30 gene was expressed at low levels, and Ezh2 bound mainly downstream of the TSS with menin binding mainly upstream of the TSS (F) (Fig. 4B).
FIG 6
FIG 6
Changes in the binding states of Ezh2 and menin during T cell development from ES cells. (A) Circos visualization of comparison of Ezh2 and menin binding states between ES and T cells (43). The colors of the outer arch indicate Ezh2/menin binding states in ES and T cells. The colors of the inner arch on the right side indicate the original binding states of Ezh2 and menin in ES cells. Links of genes upregulated or downregulated during T cell development are indicated. The green rectangle indicates the region of enlarged view shown in the right panel. (B and C) Comparison of transcription levels (upper) and their binding positioning (lower) between ES and T cells. (B) Genes showing menin mono-occupancy in ES cells and Ezh2 mono-occupancy in T cells were analyzed, and genes downregulated in T cells compared to ES cells were used for the assessment of Ezh2 and menin binding. (C) Genes showing Ezh2 mono-occupancy in ES cells and menin mono-occupancy in T cells were analyzed, and genes upregulated in T cells compared to ES cells were used for the assessment of Ezh2 and menin binding. (D) Percentage of cooccupancy, Ezh2 mono-occupancy, menin mono-occupancy, or null occupancy-derived menin mono-occupied genes in T cells for the category shown on the left side of each bar. (E) Genes showing Ezh2 mono-occupancy in ES cells and Ezh2 and menin cooccupancy in T cells were analyzed, and genes upregulated in T cells compared to ES cells were used for the assessment of Ezh2 and menin binding. (B, C, and E) All dots corresponding to the genes shown in Fig. 5E and Fig. S6D to K in the supplemental material are highlighted.
FIG 7
FIG 7
Disruption of Ezh2/menin cooccupancy by trichostatin A (TSA). (A) TSA treatment upregulated 44 of 230 cooccupied genes in Th2 cells. A pie chart illustrates the frequency of Ezh2 and menin cooccupancy and mono-occupancy in these 44 genes. (B and C) Binding of Ezh2 and menin at representative loci in Th2 and TSA-treated Th2 cells. ChIP-Seq profiles are shown across two loci (chromosome 4, 3875000 to 3845000 [B]; chromosome 2, 127940000 to 127960000 [C]).

Similar articles

Cited by

References

    1. Schuettengruber B, Chourrout D, Vervoort M, Leblanc B, Cavalli G. 2007. Genome regulation by polycomb and trithorax proteins. Cell 128:735–745. doi:10.1016/j.cell.2007.02.009. - DOI - PubMed
    1. Schuettengruber B, Martinez AM, Iovino N, Cavalli G. 2011. Trithorax group proteins: switching genes on and keeping them active. Nat Rev Mol Cell Biol 12:799–814. doi:10.1038/nrm3230. - DOI - PubMed
    1. Nakayama T, Yamashita M. 2009. Critical role of the Polycomb and Trithorax complexes in the maintenance of CD4 T cell memory. Semin Immunol 21:78–83. doi:10.1016/j.smim.2009.02.001. - DOI - PubMed
    1. Margueron R, Reinberg D. 2011. The Polycomb complex PRC2 and its mark in life. Nature 469:343–349. doi:10.1038/nature09784. - DOI - PMC - PubMed
    1. Onodera A, Nakayama T. 2015. Epigenetics of T cells regulated by Polycomb/Trithorax molecules. Trends Mol Med 21:330–340. doi:10.1016/j.molmed.2015.03.001. - DOI - PubMed

Publication types

Substances