. 2015 Oct;22(5):307-18.
doi: 10.1093/dnares/dsv013. Epub 2015 Aug 31.

Transient bursts of Zscan4 expression are accompanied by the rapid derepression of heterochromatin in mouse embryonic stem cells

Affiliations

Transient bursts of Zscan4 expression are accompanied by the rapid derepression of heterochromatin in mouse embryonic stem cells

Tomohiko Akiyama et al. DNA Res. 2015 Oct.

Abstract

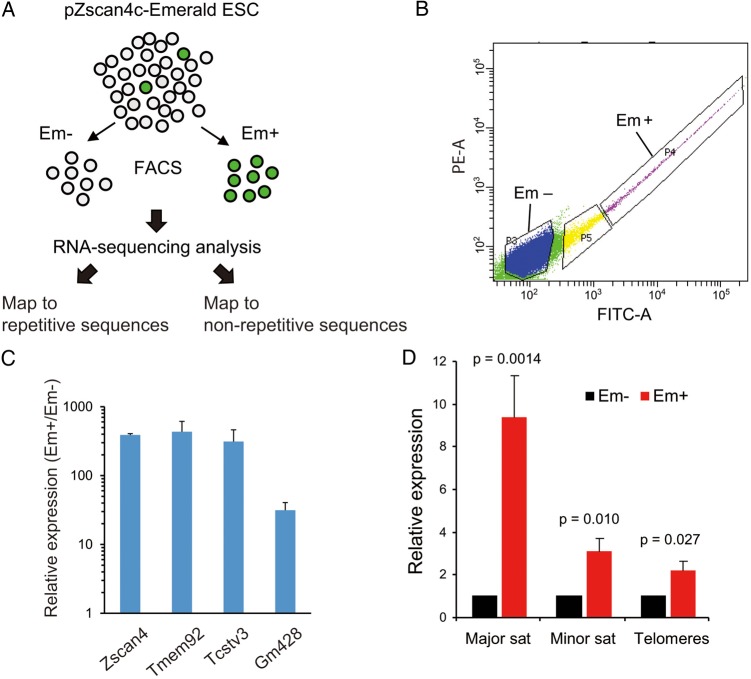
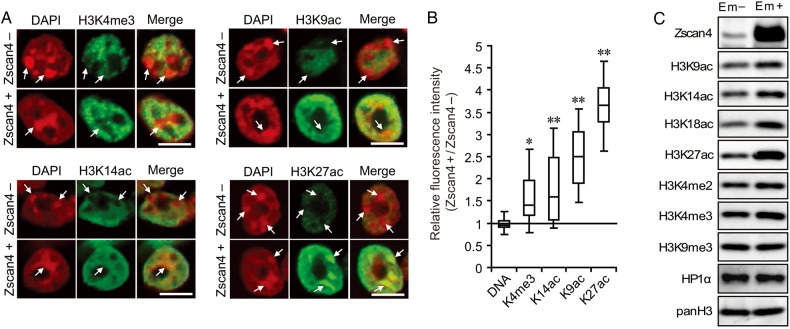
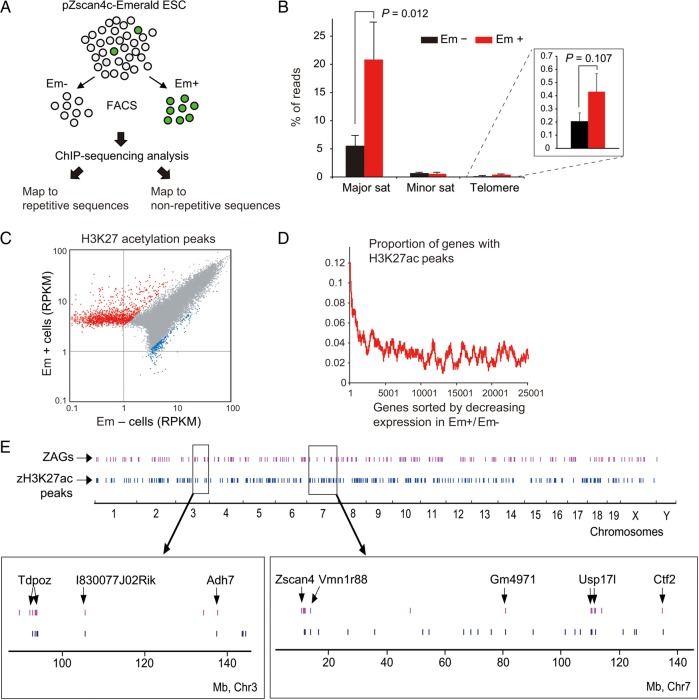
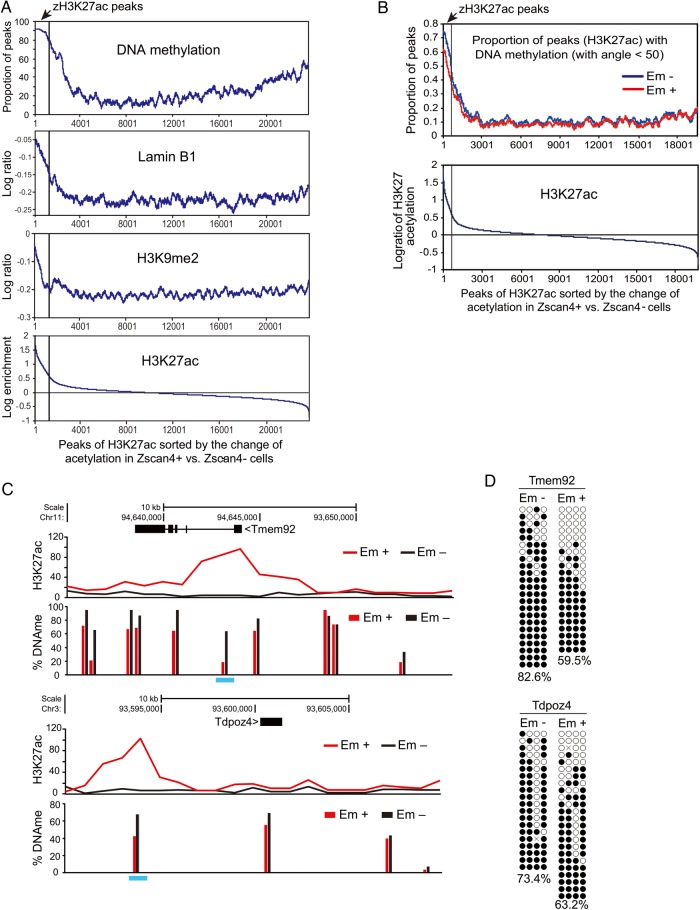
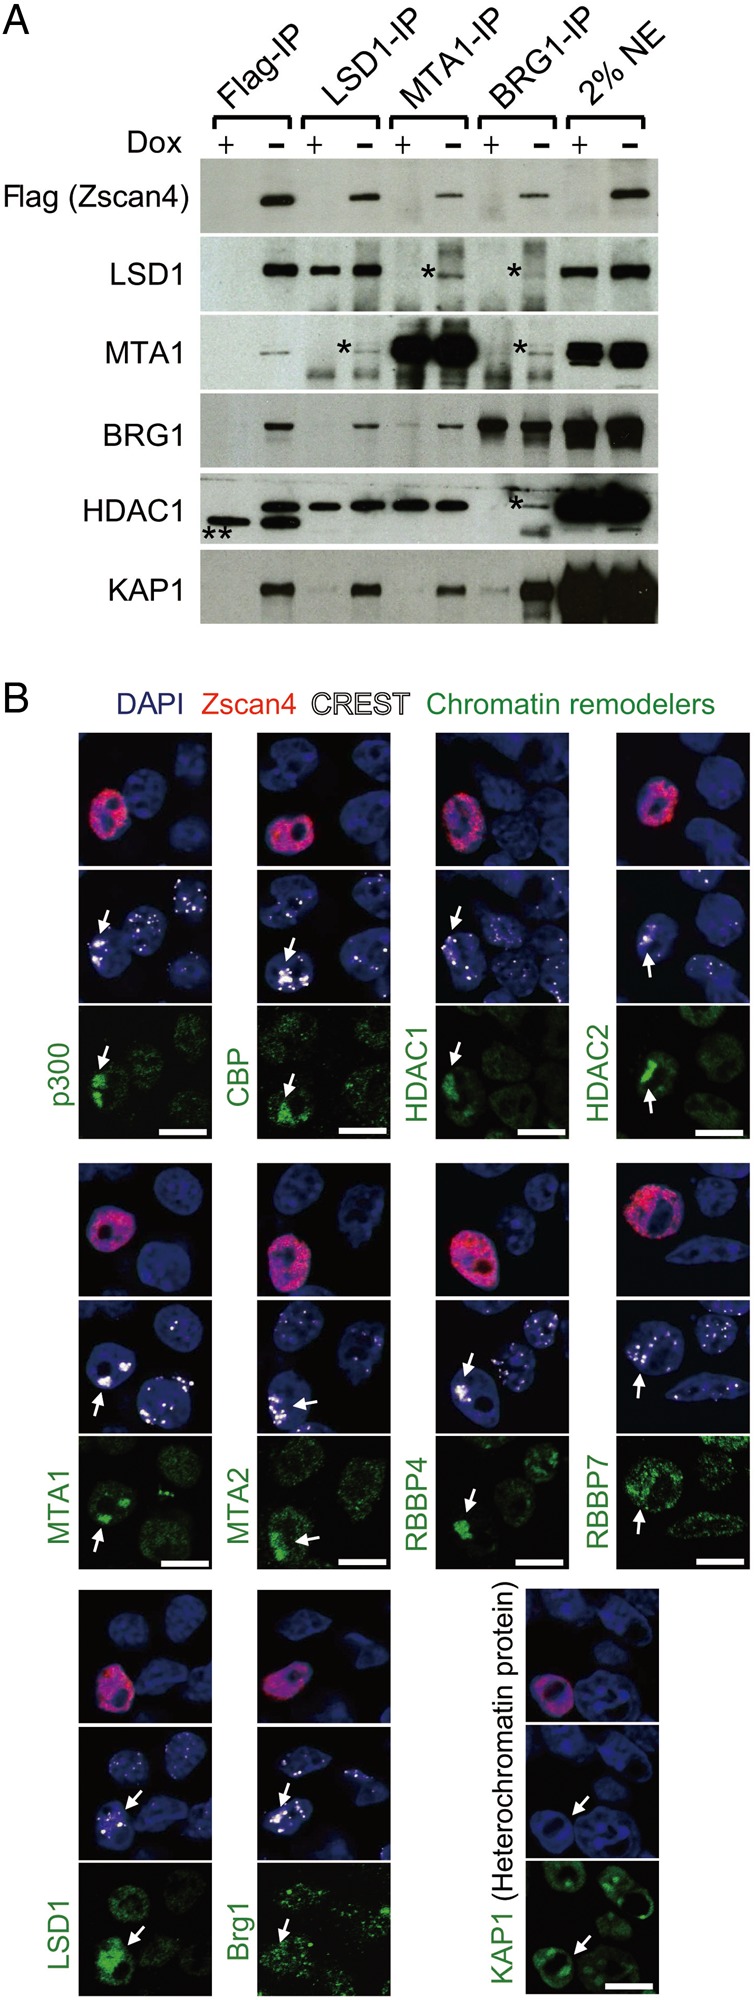
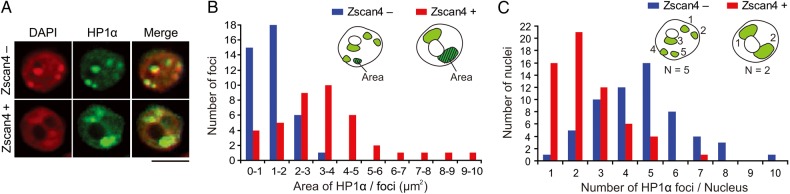
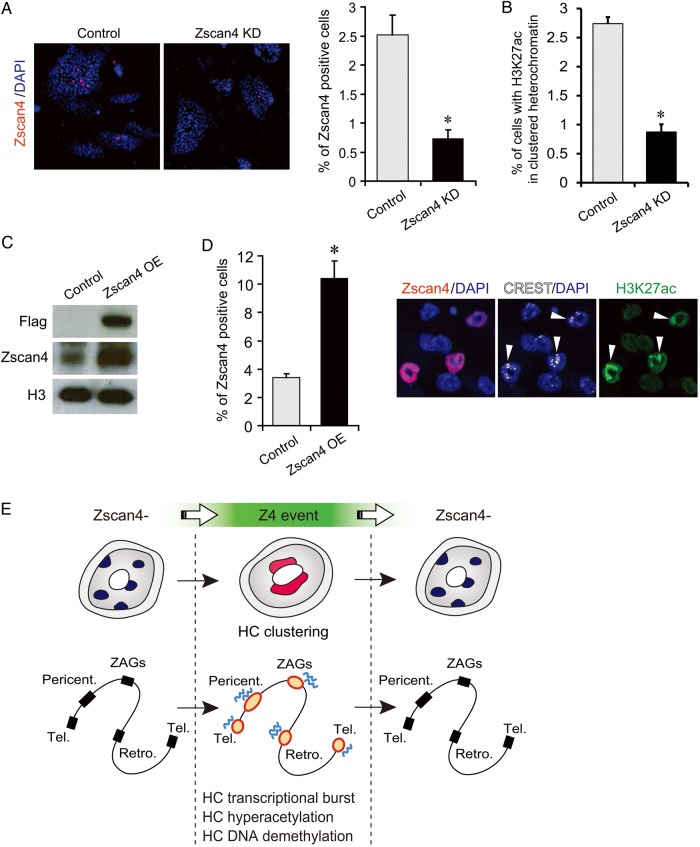
Mouse embryonic stem cells (mESCs) have a remarkable capacity to maintain normal genome stability and karyotype in culture. We previously showed that infrequent bursts of Zscan4 expression (Z4 events) are important for the maintenance of telomere length and genome stability in mESCs. However, the molecular details of Z4 events remain unclear. Here we show that Z4 events involve unexpected transcriptional derepression in heterochromatin regions that usually remain silent. During a Z4 event, we see rapid derepression and rerepression of heterochromatin leading to a burst of transcription that coincides with transient histone hyperacetylation and DNA demethylation, clustering of pericentromeric heterochromatin around the nucleolus, and accumulation of activating and repressive chromatin remodelling complexes. This heterochromatin-based transcriptional activity suggests that mESCs may maintain their extraordinary genome stability at least in part by transiently resetting their heterochromatin.

Keywords: embryonic stem cells; heterochromatin; pericentromere.


Figures

Figure 1.
Figure 1.
Zscan4-associated heterochromatin transcription in mouse ES cells. (A) A schematic presentation for whole transcriptome analyses of ES cells in the Zscan4+ cells and Zscan4 cells. (B) FACS sorting of ES cells into Emerald-positive cells (Em+, Zscan4+ cells) and Emerald-negative cells (Em, Zscan4 cells). (C) Expression levels of Zscan4-related genes (Zscan4, Tmem92, Tcstv3, Gm428) in FACS-sorted Em+ cells compared with Em cells. The expression levels were normalized by GAPDH. Error bars, S.D. (D) Abundance of sequence reads matched to major satellites, minor satellites, and telomeres in the Em+ cells relative to that in Em cells. Error bars, S.E. See also Supplementary Fig. S1. This figure is available in black and white in print and in colour at DNA Research online.
Figure 2.
Figure 2.
Activation of heterochromatin in the Zscan4+ cells. (A) ES cells were co-immunostained for Zscan4 (not shown) and euchromatin markers—H3K4me3, H3K9ac, H3K14ac, and H3K27ac (green). DNA was counterstained with DAPI (red). Arrows indicate DNA-dense heterochromatin foci. Scale bars, 5 µm. (B) Fluorescence intensities of euchromatin markers in the Zscan4+ cells compared with those in the Zscan4 cells. n = 15 for each group. Error bars, S.D. *P < 0.01, **P < 0.001. (C) Immunoblot analyses of Zscan4, H3K9ac, H3K14ac, H3K18ac, H3K27ac, H3K4me2, H3K4me3, H3K9me3, HP1α, and pan-H3 marker. The MC1-ZE7 cells were FACS-sorted into cells with Em+ (i.e. Zscan4+ cells) and cells with Em (i.e. Zscan4 cells) and analysed by the immunoblotting. See also Supplementary Fig. S2.
Figure 3.
Figure 3.
Correlation between histone hyperacetylations and gene expression in the Zscan4+ cells. (A) MC1-ZE7 cells were FACS-sorted into Em+ and Em cells and analysed by the ChIP-seq using an anti-H3K27ac antibody. (B) Fractions (%) of sequence reads matched to major satellites, minor satellites, and telomeres in the Em+ or Em cells. Error bars, S.E. (C) A scatterplot showing the comparison of H3K27ac peaks between the Em+ and Em cells. Red dots (1,429), named ‘zH3K27ac peaks’, indicate H3K27ac peaks with significantly more (>3-fold) sequence reads in the Em+ cells compared with the Em cells. (D) A plot showing the correlation between the gene expression differences in Em+ versus Em cells (x-axis) and the proportion of genes with at least one zH3K27ac peak within 100 Kb from TSS, identified with a sliding window of 500 genes (y-axis). (E) Localizations of ZAGs (purple) and zH3K27ac peaks (blue) on mouse genomes. See also Supplementary Fig. S3.
Figure 4.
Figure 4.
DNA demethylation coupled with histone hyperacetylation in heterochromatin in Zscan4+ cells. (A) Proportion of H3K27ac peaks with the high levels of DNA methylation (>50% methylated CpGs per total CpGs by the bisulfite sequencing), the average log-enrichment in binding of Lamin B1, the average log-enrichment of H3K9me2, and the log-enrichment of H3K27ac, in a sliding window of 300 H3K27ac peaks, which were sorted by the difference in the H3K27ac between Em+ and Em cells. (B) Comparison of DNA methylation levels with the changes in H3K27ac levels between Em+ and Em cells. H3K27ac peaks were sorted by the decreasing log ratio of H3K27ac in the Em+ versus Em cells (x-axis), and then the proportion of peaks with DNA methylation (y-axis) was estimated in a sliding window of 300 peaks. (C) Representative examples of genes with H3K27 hyperacetylation (H3K27ac ChIP-seq, this study) and DNA demethylation (by the HELP assay, this study) in the Em+ cells compared with the Em cells. (D) Bisulfite sequencing analyses of Tmem92 and Tdpoz4 regions (blue bars in Fig. 4C) were performed on Em+ and Em cells. Open and filled circles indicate unmethylated or methylated CpG sites, respectively. The percentage of methylated CpGs per total CpGs is presented below each data set. See also Supplementary Fig. S4.
Figure 5.
Figure 5.
Both activating and repressing chromatin remodelling complexes localize in heterochromatin in the Zscan4+ cells. (A) Immunoblot analyses of Flag-Zscan4, Lsd1/Kdm1a, Mta1, Brg1, Hdac1, and Kap1/Trim28 proteins after immunoprecipitating the nuclear extracts of tet-Zscan4 ES cells by antibodies against Flag-tag, Lsd1/Kdm1a, Mta1, and Brg1. The tet-Zscan4 ES cells were cultured in the Dox+ (without Zscan4 overexpression) and Dox (with Zscan4 overexpression) for 3 days. *, possible cross-reactive polypeptides. **, non-specific bands. (B) Triple immunostaining analyses of ES cells with the Zscan4 antibody (red), the CREST antibody (white, an anti-centromere protein), and various antibodies indicated (green). Blue, DAPI. Arrows indicate the clustered centromeres. Scale bars, 5 µm. See also Supplementary Fig. S5.
Figure 6.
Figure 6.
Heterochromatin clustering in the Zscan4+ cells. (A) Co-immunostaining of ES cells with an HP1α antibody (green) and a Zscan4 antibody (not shown). Red, DAPI. Scale bars, 5 µm. More examples are shown in Supplementary Fig. S2A. (B) Size distribution of nuclear foci stained with an HP1α antibody in the Zscan4+ cells (red bars) and in the Zscan4 cells (blue bars). Average areas of each focus was 3.6 and 1.5 µm2 in the Zscan4+ cells and in the Zscan4 cells, respectively. n = 40. (C) Number distribution of nuclear foci stained with an HP1α antibody in the Zscan4+ cells (red bars) and in the Zscan4 cells (blue bars). Average numbers of foci in each nucleus were 2.4 and 4.7 in the Zscan4+ cells and in the Zscan4 cells, respectively. n = 60. See also Supplementary Fig. S6.
Figure 7.
Figure 7.
Active roles of Zscan4 in the heterochromatin regulation revealed by Zscan4 knockdown and Zscan4 overexpression experiments. (A, B) Inducible knockdown of Zscan4 expression (Zscan4 KD). (A) Left panel: Immunostaining analyses of the ES cells expressing a Dox-inducible shRNA against Zscan4, cultured for 8 days in the absence (−Dox) or the presence of 2 µg/ml Dox (+Dox), with the antibody against Zscan4 (red). DNA is counterstained with DAPI (red). Right panel: The percentage of cells stained with a Zscan4 antibody was significantly reduced by the Dox treatment (*P < 0.01, t-test). Error bars indicate S.D. (B) The percentage of the cells with H3K27 acetylation in heterochromatin was significantly reduced by the Dox treatment (*P < 0.01, t-test). Error bars indicate S.D. (C, D) Inducible overexpression of Zscan4 using tet-Zscan4 cells (Zscan4 OE). (C) Western blots using an anti-Flag antibody, anti-Zscan4 antibody, and anti-histone H3 antibody (loading control). (D) Left panel: The percentage of Zscan4+ cells in the Dox+ and Dox conditions. *P < 0.01 versus +Dox, t-test. Right panel: Immunostaining of tet-Zscan4 ES cells with an anti-Zscan4, anti-CREST, and anti-H3K27ac. The nuclei of the Zscan4+ cells showed the hyperacetylation of H3K27 in clustered centromeric regions (arrows). (E) A schematic summary of heterochromatin dynamics during Z4 event. Tel., telomeres, Pericent., pericentromeres, Retro., retrotransposons, ZAGs, Z4 event-associated genes. See also Supplementary Fig. S7.

Similar articles

Cited by

References

    1. Evans M.J., Kaufman M.H.. 1981, Establishment in culture of pluripotential cells from mouse embryos, Nature, 292, 154–6. - PubMed
    1. Martin G.R. 1981, Isolation of a pluripotent cell line from early mouse embryos cultured in medium conditioned by teratocarcinoma stem cells, Proc. Natl Acad. Sci. USA, 78, 7634–8. - PMC - PubMed
    1. Bradley A., Evans M., Kaufman M.H., Robertson E.. 1984, Formation of germ-line chimaeras from embryo-derived teratocarcinoma cell lines, Nature, 309, 255–6. - PubMed
    1. Suda Y., Suzuki M., Ikawa Y., Aizawa S.. 1987, Mouse embryonic stem cells exhibit indefinite proliferative potential, J. Cell Physiol., 133, 197–201. - PubMed
    1. Festuccia N., Osorno R., Wilson V., Chambers I.. 2013, The role of pluripotency gene regulatory network components in mediating transitions between pluripotent cell states, Curr. Opin. Genet. Dev., 23, 504–11. - PMC - PubMed

Publication types