. 2015 Sep 21;212(10):1725-38.
doi: 10.1084/jem.20140654. Epub 2015 Aug 31.

NOS1-derived nitric oxide promotes NF-κB transcriptional activity through inhibition of suppressor of cytokine signaling-1

Affiliations

NOS1-derived nitric oxide promotes NF-κB transcriptional activity through inhibition of suppressor of cytokine signaling-1

Mirza Saqib Baig et al. J Exp Med. .

Abstract

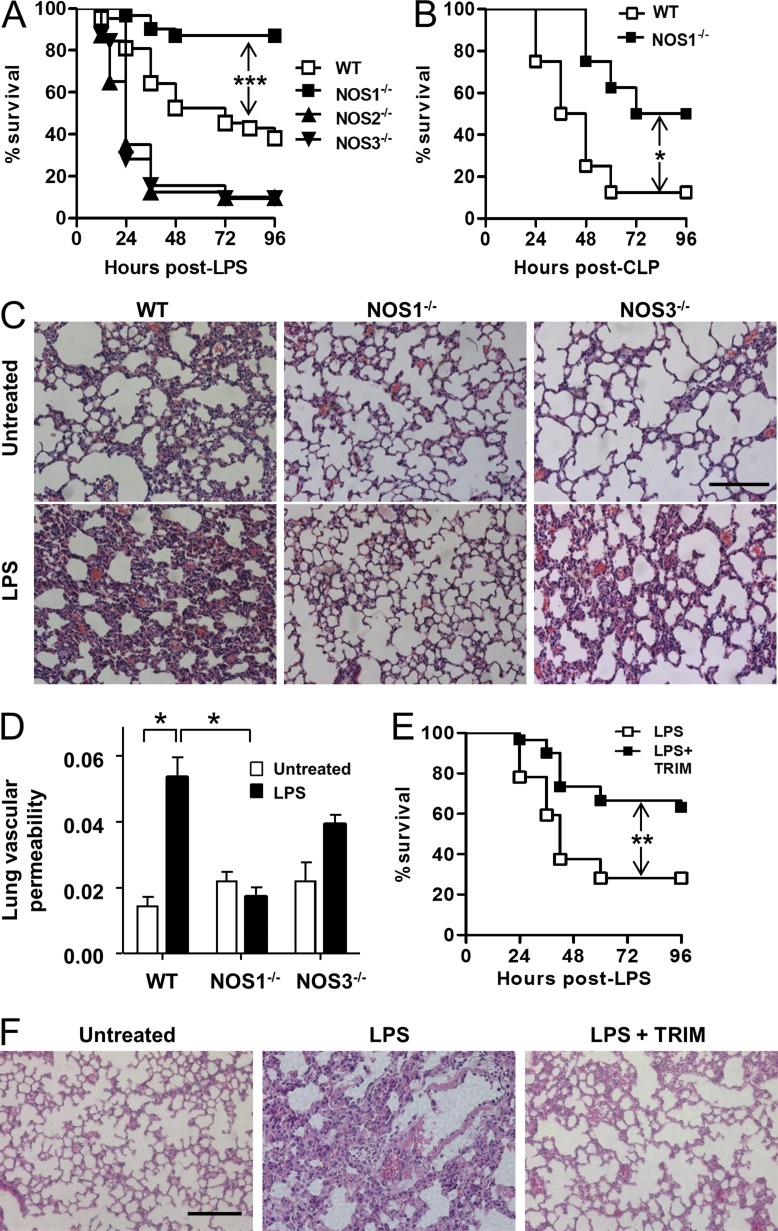
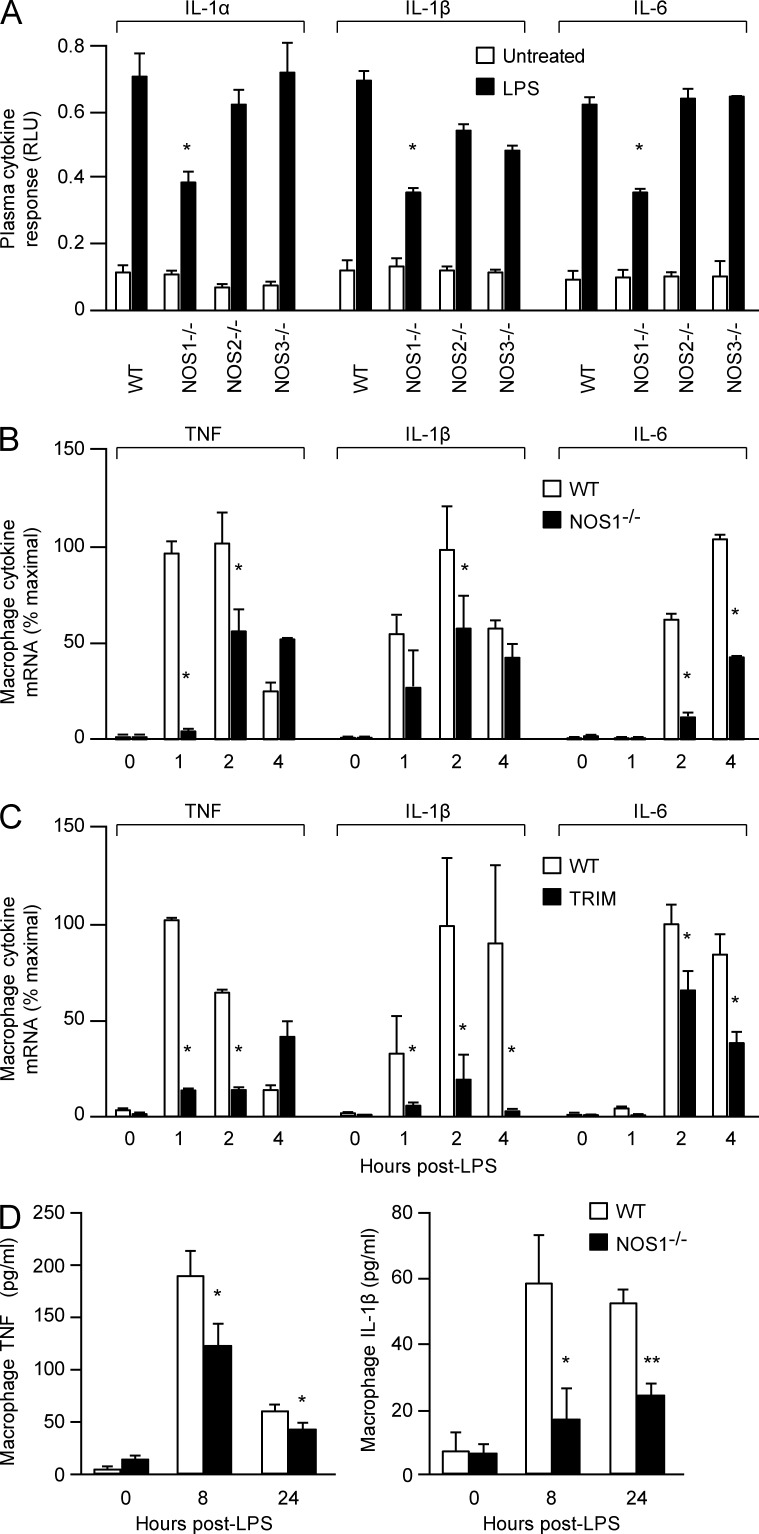
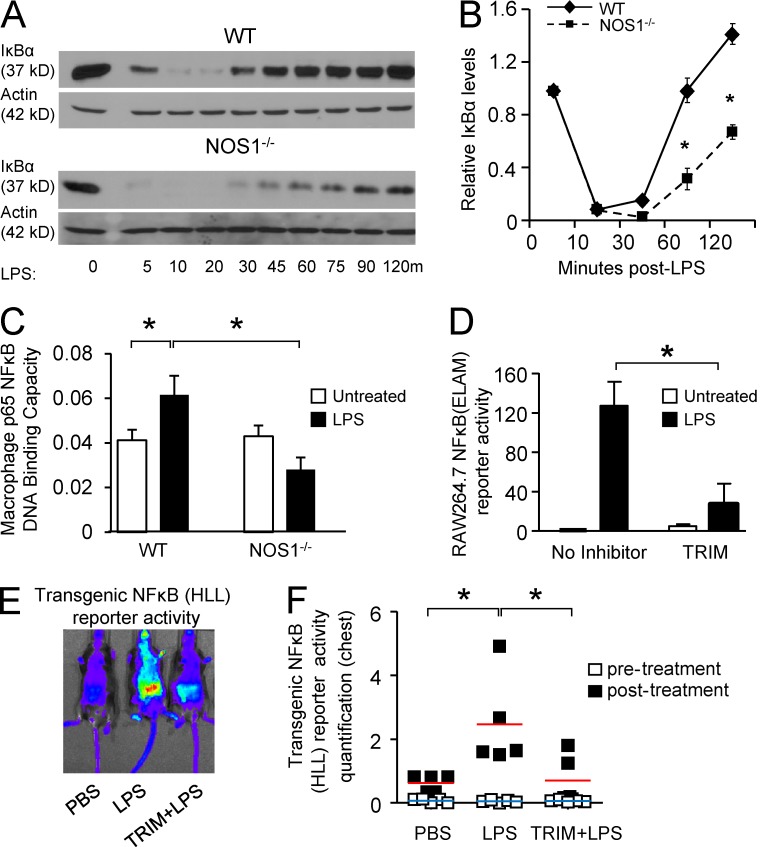
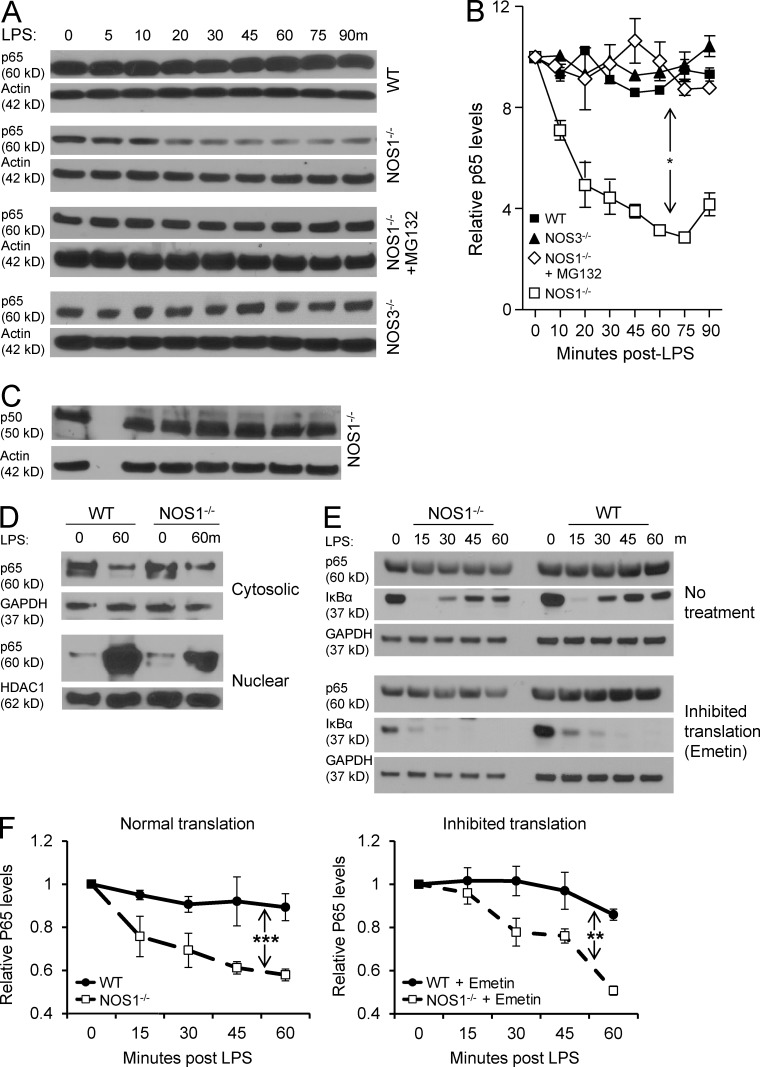
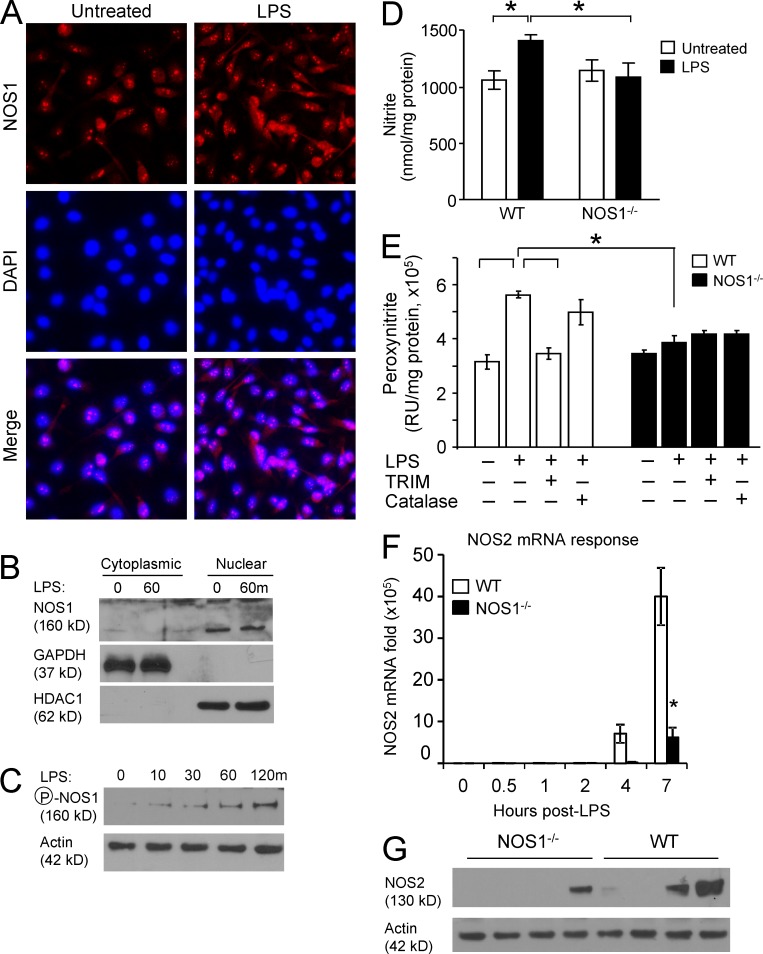
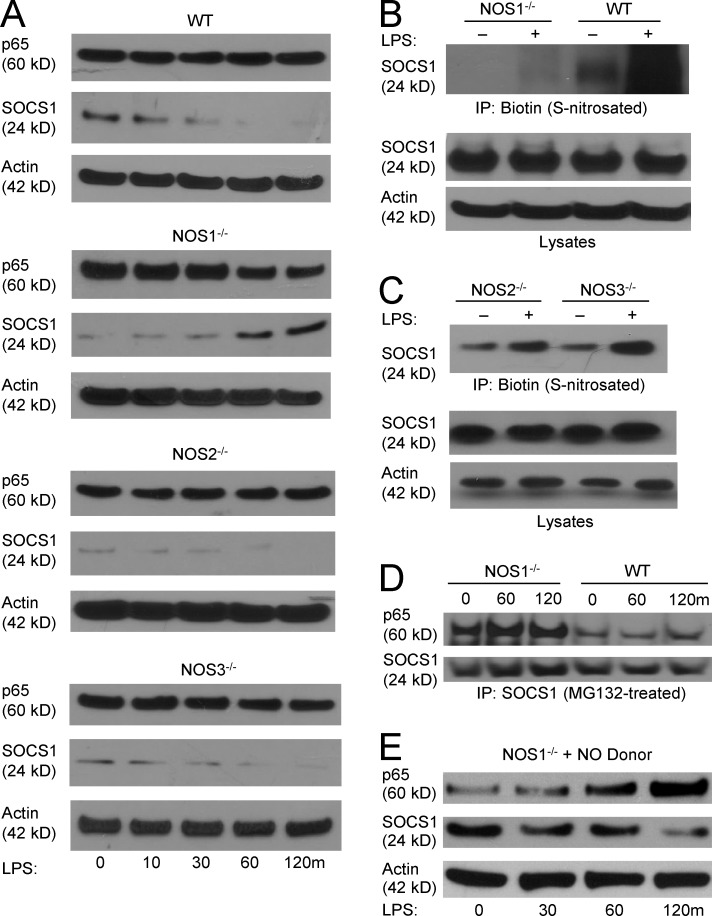
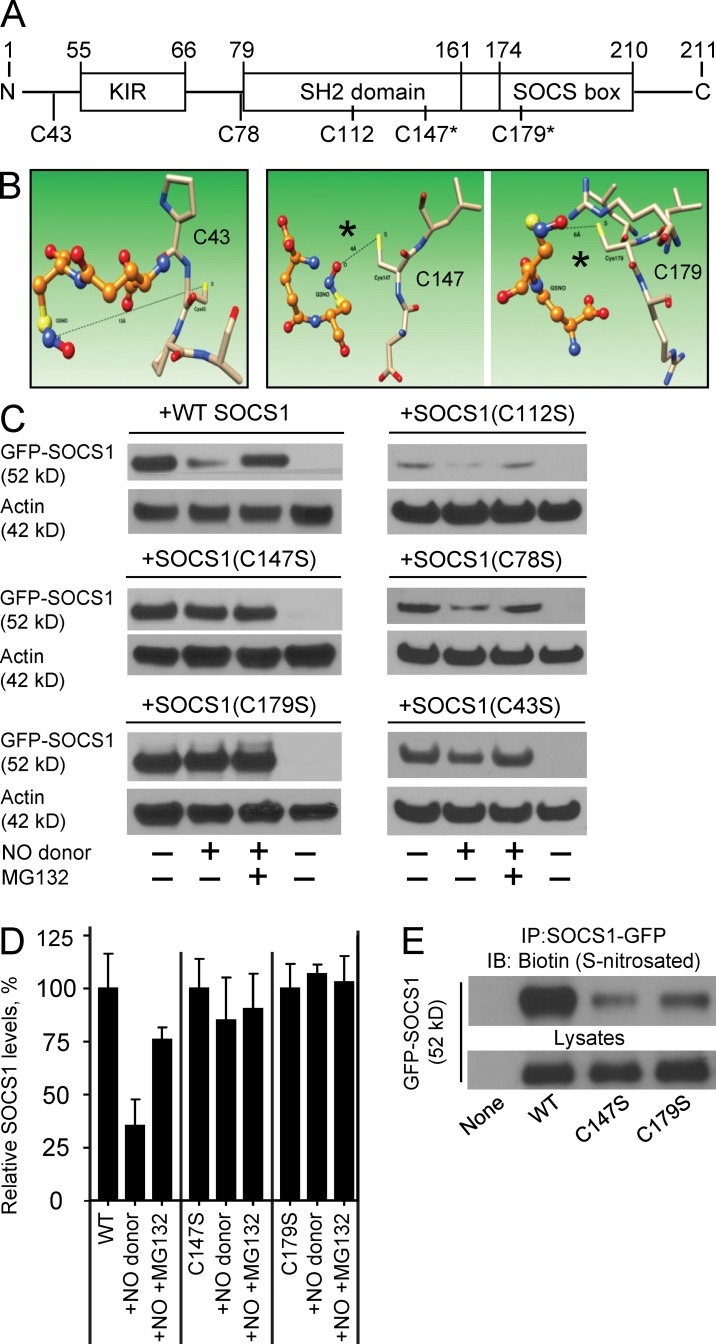
The NF-κB pathway is central to the regulation of inflammation. Here, we demonstrate that the low-output nitric oxide (NO) synthase 1 (NOS1 or nNOS) plays a critical role in the inflammatory response by promoting the activity of NF-κB. Specifically, NOS1-derived NO production in macrophages leads to proteolysis of suppressor of cytokine signaling 1 (SOCS1), alleviating its repression of NF-κB transcriptional activity. As a result, NOS1(-/-) mice demonstrate reduced cytokine production, lung injury, and mortality when subjected to two different models of sepsis. Isolated NOS1(-/-) macrophages demonstrate similar defects in proinflammatory transcription on challenge with Gram-negative bacterial LPS. Consistently, we found that activated NOS1(-/-) macrophages contain increased SOCS1 protein and decreased levels of p65 protein compared with wild-type cells. NOS1-dependent S-nitrosation of SOCS1 impairs its binding to p65 and targets SOCS1 for proteolysis. Treatment of NOS1(-/-) cells with exogenous NO rescues both SOCS1 degradation and stabilization of p65 protein. Point mutation analysis demonstrated that both Cys147 and Cys179 on SOCS1 are required for its NO-dependent degradation. These findings demonstrate a fundamental role for NOS1-derived NO in regulating TLR4-mediated inflammatory gene transcription, as well as the intensity and duration of the resulting host immune response.


Figures

Figure 1.
Figure 1.
NOS1 deficiency protects against model septic injury. (A) Survival of WT (n = 42), NOS1−/− (n = 31), NOS2−/− (n = 40), and NOS3−/− (n = 32) mice injected with LPS (30 mg/kg, i.p.), compiled from at least 3 independent experiments using 10 mice per group, or (B) WT (n = 8) and NOS1−/− (n = 8) mice, compiled from 2 independent experiments, were subjected to CLP and survival was monitored for the indicated time. (C) Lungs of WT, NOS3−/−, and NOS1−/− mice were harvested 8 h after i.p. LPS challenge and sections were stained with H&E. Representative images from three mice per phenotype analyzed in three independent experiments are shown. Bar, 100 µM. (D) Lung vascular permeability measurements (Kfc) of WT, NOS3−/−, and NOS1−/−, mice before and 8 h after LPS challenge. Three mice per phenotype were analyzed in three independent experiments. *, P < 0.05, Student’s t test. (E) Survival of WT mice treated with LPS alone (n = 32) or pretreated for 2 h with TRIM (25 mg/kg, i.p.) before LPS (n = 30), compiled from at least 3 independent experiments with 10 mice per group (F). Lung histological analyses were performed on WT mice as in C, either control or with pretreatment with TRIM, as in E. Significance in A–C was determined using Fisher’s exact test. *, P < 0.02 (B); **, P < 0.001 (E); ***, P < 0.0005 (A).
Figure 2.
Figure 2.
Proinflammatory cytokine responses to LPS are diminished in NOS1−/− animals and cultured macrophages. (A) IL-1α, IL-1β, and IL-6 in the plasma of WT, NOS1−/−, NOS2−/−, and NOS3−/− mice before and 8 h after LPS (30 mg/kg, i.p.) injection. Cytokine levels in plasma were assessed using a Luminex panel and expressed as relative light units (RLU). Nine mice for each treatment condition and genotype were analyzed and data are compiled from three independent experiments, mean ± SEM. *, P < 0.005 (Student’s t test). (B) Quantitative RT-PCR analysis of cytokine mRNA expression of TNF, IL-6, and IL-1β in BMDMs isolated from WT and NOS1-/ mice and stimulated with LPS (250 ng/ml). *, P < 0.0005. (C) mRNA expression analysis of TNF, IL-6, and IL-1β in WT macrophages (no inhibitor) and WT macrophages treated 2 h with TRIM (100 nM) before LPS (250 ng/ml) stimulation. *, P < 0.003 (Student’s t test). (D) ELISA measurements of TNF and IL-1β cytokine levels in culture media of LPS-activated BMDM (250 ng/ml). *, P < 0.02; **, P < 0.001 (Student’s t test). Representative data are shown from three (B–D) independent experiments, and are expressed as mean ± SD.
Figure 3.
Figure 3.
NOS1 is required for NF-κB transcriptional activation but not upstream signaling. (A) Representative immunoblots for IκB degradation after LPS treatment (250 ng/ml) from WT and NOS1−/− BMDMs. (B) Densitometry analysis of IκB levels as in (A), normalized to actin, presented as mean ± SEM of quantitation of three independent experiments. *, P < 0.02 (Student’s t test). (C) p65 DNA-binding activity was assayed from the isolated nuclei of WT and NOS1−/− BMDM before and after LPS (250 ng/ml) for 1 h. *, P < 0.001, Student’s t test. (D) RAW264.7 macrophage cell line stably expressing an NF-κB–driven luciferase reporter (ELAM) were pretreated with TRIM (50 µM) for 2 h and then stimulated with LPS (100 ng/ml) for 6 h. *, P < 0.0005, Student’s t test. C and D are representative of three independent experiments, presented as mean ± SD of three replicates. Representative digital images of (E) and quantitation of (F) NF-κB transcriptional activity from mice expressing a transgenic luciferase reporter (HLL) 24 h after treatment with PBS (control), LPS or LPS after 2 h pretreatment with TRIM (50 mg/kg, i.p.) to inhibit NOS1. Luminescence was evaluated by IVIS 10 min after i.p. injection of 30 mg/kg luciferin. Quantitation focused on activity in the chest (n = 6 animals per group compiled from two separate experiments using 3 mice per treatment), and includes basal reporter activity before LPS or PBS treatment for comparison. *, P < 0.05 (Student’s t test). Averages are shown as horizontal bars, red for treated, and blue for control values.
Figure 4.
Figure 4.
NOS1−/− BMDM fail to maintain p65 protein levels after exposure to LPS. Representative immunoblots (A) and densitometric quantitation (B) of NF-κB p65 protein levels in BMDM stimulated with LPS (250 ng/ml), normalized to actin, for the indicated times and genotypes. Where indicated, cells were pretreated with MG132 (50 µM, proteasome inhibitor). *, P < 0.01. (C) Immunoblot analysis of total NF-κB p50 levels in NOS1−/− macrophages after LPS (250 ng/ml). (D) Isolated cytoplasmic and nuclear fractions of WT and NOS1−/− BMDM were probed for p65 by immunoblot before and after LPS (250 ng/ml) for 60 min, GAPDH and HDAC1 are loading controls for cytoplasmic or nuclear protein, respectively. p65 protein degradation dynamics was assessed by (E) immunoblot and (F) densitometric quantitation (normalized to GAPDH) after inhibition of de novo protein synthesis by treatment of BMDM with emetin (100 µg/ml) or control, followed by LPS (250 ng/ml) for the indicated times. The loss of IκBα re-expression demonstrates the effective inhibition of protein translation. For all of the above experiments, representative blots are shown from 3 independent experiments and quantitation, based on all experiments, are presented as mean ± SEM. P-values were determined by Anova two-way test with Bonferroni post-test to compare replicates: *, P < 0.02; **, P < 0.001; and ***, P < 0.0001.
Figure 5.
Figure 5.
NOS1 localizes to the nuclei of macrophages and is required for rapid NO production after LPS treatment. (A) Nuclear localization of NOS1 was demonstrated in BMDM after fixation and immunostaining for NOS1 (red), nuclei were counterstained with DAPI and representative images from 2 independent experiments are shown (bar, 25 µM). (B) BMDM cytoplasmic and nuclear fractions were immunoblotted to demonstrate the subcellular location of NOS1. GAPDH and HDAC1 serve as controls for subcellular fractionation. (C) NOS1 Serine 1412 phosphorylation, which correlates with enzymatic activation, was assayed by immunoblot of BMDM stimulated with LPS (100 ng/ml) for the indicated time points. Data are representative of three independent experiments. (D) Nitrite accumulation, as an indirect measure of NO production, was detected in the supernatants of WT and NOS1−/− BMDM using a Sievers 280i Nitric Oxide Analyzer, before or after LPS (100 ng/ml for 1 h). *, P < 0.05. (E) Peroxynitrite production, another indirect measure of NO production, was assayed by incubating WT or NOS1−/− BMDM with coumarin-7-boronic acid (10 µM) for 30 min, with or without LPS (100 ng/ml). Fluorescence measurement was performed using HPLC. *, P < 0.0003. (F) Quantitative RT-PCR analysis of LPS-induced NOS2 mRNA and (G) immunoblot analysis of NOS2 protein, from WT and NOS1−/− BMDM treated with LPS (250 ng/ml) demonstrates no detection of the inducible NOS (NOS2) at early time points after LPS in BMDM of either genotype. P < 0.01 (Student’s t test). Data are representative of six (D and E) and three (F) independent experiments; all are presented as mean ± SD. Data in B, C, and G are representative of three independent experiments.
Figure 6.
Figure 6.
NOS1-derived NO mediates S-nitrosation of SOCS1 and prevents SOCS1-mediated proteasomal degradation of p65. (A) Immunoblot analysis of p65 and SOCS1 in WT, NOS1−/−, NOS2−/−, and NOS3−/− BMDM treated with LPS (250 ng/ml) for the indicated times. (B) SOCS1 S-nitrosation was detected using the biotin switch method on protein from WT and NOS1−/− BMDMs pretreated with MG132 (50 µM) for 1 h before treatment with LPS (250 ng/ml) for the indicated times, followed by immunoblotting for SOCS1. (C) NOS2−/− and NOS3−/− BMDMs analyzed by biotin switch method, as in B. (D) Co-immunoprecipitation of SOCS1 and p65 in WT and NOS1−/− BMDMs, pretreated with MG132 (50 µM, 1 h) before LPS (250 ng/ml) for the indicated time intervals. (E) Immunoblot analysis of p65 and SOCS1 total protein levels in NOS1−/− BMDM treated with DEANO (NO donor, 5 µM) and LPS (250 ng/ml). All blots shown are representative of at least two (C and D) or three (A, B, and E) independent experiments.
Figure 7.
Figure 7.
Molecular modeling and functional testing demonstrate that Cys147 and Cys179 of SOCS1 are the targets for S-nitrosation. (A) Protein domain structure of SOCS1 illustrating the positions of all 5 candidate cysteine residues. (B) Molecular modeling was performed to predict the accessibility of cysteine residues of SOCS1 (represented as colored stick atomic models) to the likely transnitrosation donor, GSNO (represented as ball and stick atomic models). The shorter distances between the cysteine sulfur atom and the nitrogen of GSNO are predicted to permit S-nitrosation for Cys147 (4 Å, middle) and Cys179 (6 Å, right), whereas Cys43 (13 Å, left), Cys112 (11 Å, not depicted), and Cys78 (11 Å, not depicted) are predicted to be too far apart to permit the reaction. (C) Representative immunoblots of GFP-tagged constructs of SOCS1 or point mutations of each cysteine (C147S, C179S, C112S, C78S, and C43S) were transfected into HEK293 cells, which were then treated with a 15-min pulse of 20 ng/ml IL-1β. Some of the cells were pretreated with 50 µM proteasome inhibitor for 1 h (MG132 +) and some were treated with 10 µM DEANO for 1 h after IL-1β (NO donor +). Stability of SOCS1 protein levels was determined by immunoblot and (D) quantified relative to β-actin from three independent experiments (mean ± SEM). (E) The capacity of SOCS1 mutants C147S, and C179S for S-nitrosation was compared with WT SOCS1 in transiently transfected HEK293 cells using the biotin switch method. Immunoprecipitates of GFP-SOCS1 variants were assayed for biotin (S-nitrosation), and lysates were immunoblotted for total SOCS1 as control. Data are representative of two independent experiments.

References

    1. Aktan F. 2004. iNOS-mediated nitric oxide production and its regulation. Life Sci. 75:639–653. 10.1016/j.lfs.2003.10.042 - DOI - PubMed
    1. Alcamo E., Mizgerd J.P., Horwitz B.H., Bronson R., Beg A.A., Scott M., Doerschuk C.M., Hynes R.O., and Baltimore D.. 2001. Targeted mutation of TNF receptor I rescues the RelA-deficient mouse and reveals a critical role for NF-kappa B in leukocyte recruitment. J. Immunol. 167:1592–1600. 10.4049/jimmunol.167.3.1592 - DOI - PubMed
    1. Badrichani A.Z., Stroka D.M., Bilbao G., Curiel D.T., Bach F.H., and Ferran C.. 1999. Bcl-2 and Bcl-XL serve an anti-inflammatory function in endothelial cells through inhibition of NF-kappaB. J. Clin. Invest. 103:543–553. 10.1172/JCI2517 - DOI - PMC - PubMed
    1. Baetz A., Frey M., Heeg K., and Dalpke A.H.. 2004. Suppressor of cytokine signaling (SOCS) proteins indirectly regulate toll-like receptor signaling in innate immune cells. J. Biol. Chem. 279:54708–54715. 10.1074/jbc.M410992200 - DOI - PubMed
    1. Baltimore D. 2011. NF-κB is 25. Nat. Immunol. 12:683–685. 10.1038/ni.2072 - DOI - PubMed

Publication types

MeSH terms

Associated data