. 2015 Oct 1;195(7):2973-84.
doi: 10.4049/jimmunol.1500081. Epub 2015 Aug 31.

Ten Weeks of Infection with a Tissue-Invasive Helminth Protects against Local Immune Complex-Mediated Inflammation, but Not Cutaneous Type I Hypersensitivity, in Previously Sensitized Mice

Affiliations

Ten Weeks of Infection with a Tissue-Invasive Helminth Protects against Local Immune Complex-Mediated Inflammation, but Not Cutaneous Type I Hypersensitivity, in Previously Sensitized Mice

Holly Evans et al. J Immunol. .

Abstract

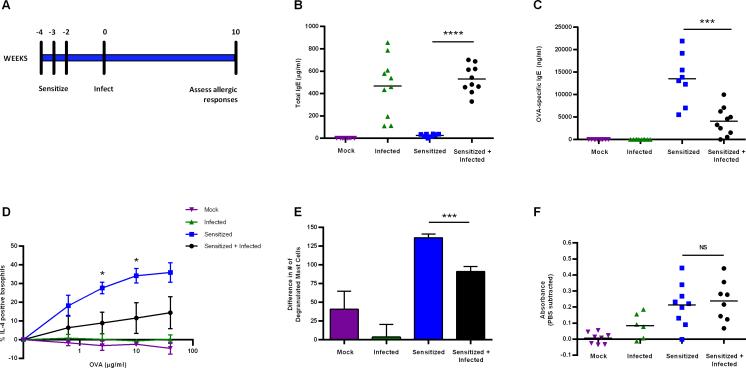
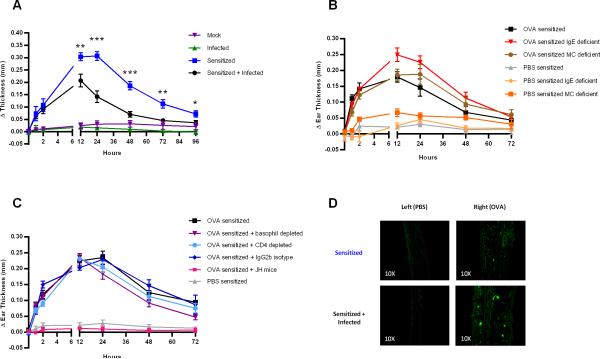
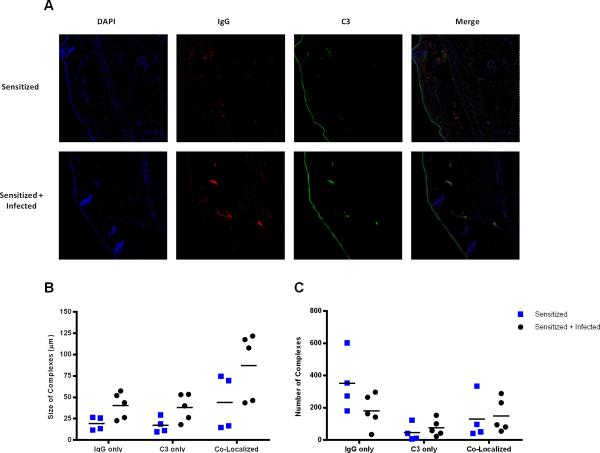
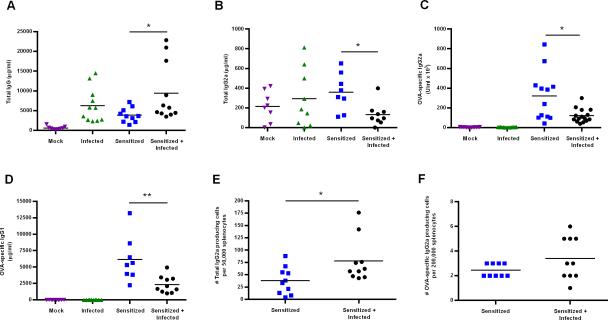
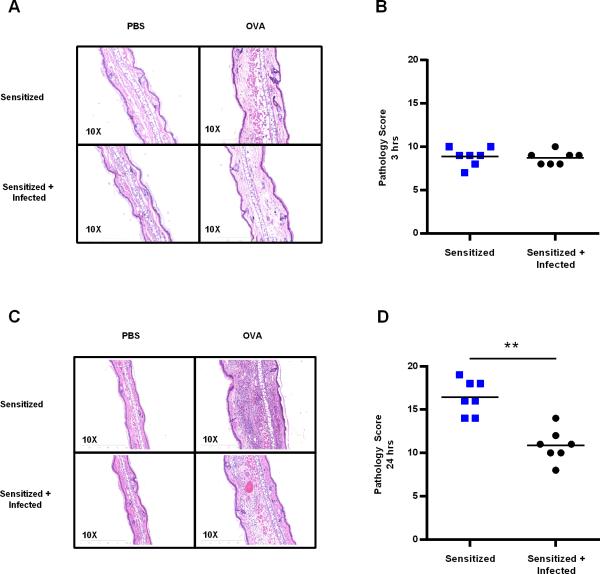
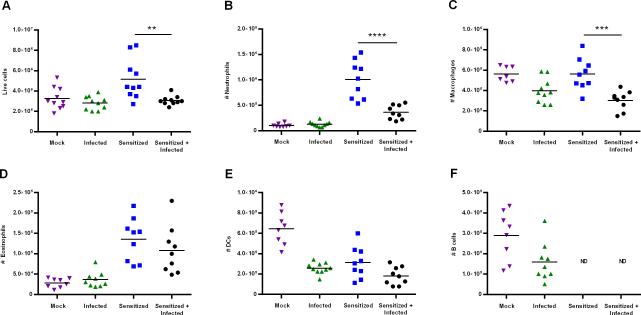
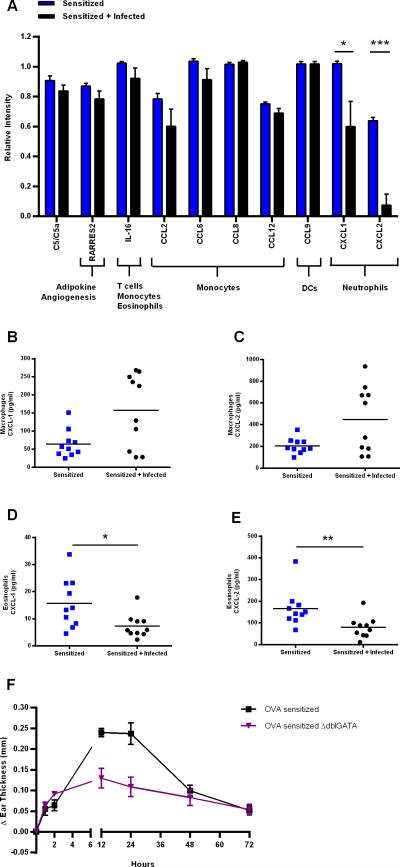
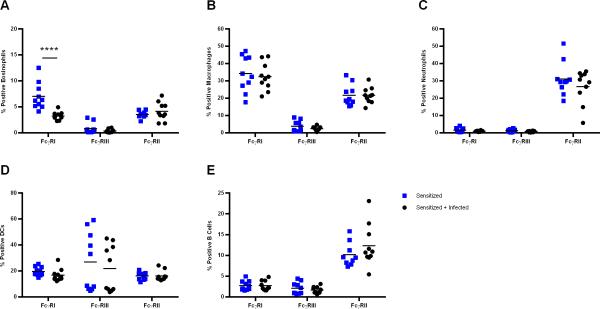
In this study, we evaluated the effect chronic helminth infection has on allergic disease in mice previously sensitized to OVA. Ten weeks of infection with Litomosoides sigmodontis reduced immunological markers of type I hypersensitivity, including OVA-specific IgE, basophil activation, and mast cell degranulation. Despite these reductions, there was no protection against immediate clinical hypersensitivity following intradermal OVA challenge. However, late-phase ear swelling, due to type III hypersensitivity, was significantly reduced in chronically infected animals. Levels of total IgG2a, OVA-specific IgG2a, and OVA-specific IgG1 were reduced in the setting of infection. These reductions were most likely due to increased Ab catabolism as ELISPOT assays demonstrated that infected animals do not have suppressed Ab production. Ear histology 24 h after challenge showed infected animals have reduced cellular infiltration in the ear, with significant decreases in numbers of neutrophils and macrophages. Consistent with this, infected animals had less neutrophil-specific chemokines CXCL-1 and CXCL-2 in the ear following challenge. Additionally, in vitro stimulation with immune complexes resulted in significantly less CXCL-1 and CXCL-2 production by eosinophils from chronically infected mice. Expression of FcγRI was also significantly reduced on eosinophils from infected animals. These data indicate that chronic filarial infection suppresses eosinophilic responses to Ab-mediated activation and has the potential to be used as a therapeutic for pre-existing hypersensitivity diseases.


Figures

Figure 1
Figure 1
Chronic L. sigmodontis infection did not protect against clinical type I hypersensitivity. (A) Experimental design for the use of L. sigmodontis as a therapeutic agent for pre-existing allergic disease. Levels of circulating total IgE (B) and OVA-specific IgE (C) were assessed by ELISA at 10 weeks post-infection. (D) Flow cytometric analysis of basophil activation in response to increasing concentrations of OVA stimulation. Basophils were gated as CD4B220IgE +, and activation was determined by intracellular IL-4 staining using fluorescence minus one controls. Values plotted represent % IL-4+ basophils after OVA stimulation minus % IL-4+ basophils after culture in media alone. Flow data are representative of two independent experiments with two animals pooled per sample and media levels subtracted. Sensitized and Sensitized + Infected groups were compared at each concentration by the Mann Whitney test. (E) Differences in mast cell degranulation between PBS and OVA challenged ears. Non-degranulated mast cells were enumerated by toluidine blue stain of ear tissue 24 hours after challenge. The total number of toluidine-positive staining cells for the OVA challenge ear was subtracted from the PBS challenge ear to quantify differences in mast cell degranulation. (F) Local anaphylaxis assay (LAA) quantification of cutaneous type I hypersensitivity reactions in response to OVA challenge, with PBS values subtracted. Unless otherwise noted, data are representative of two independent experiments with 4-5 BALB/c mice per group. Error bars represent ± SEM. *p < 0.05, ** p < 0.01, ***p < 0.001.
Figure 2
Figure 2
Immune complex-mediated ear swelling was significantly reduced Sensitized + Infected animals. (A) Ear swelling was measured by micrometer for four days following OVA and PBS challenge at 10 weeks post-infection. Data points for Sensitized and Sensitized + Infected groups were compared at each time point by the Mann Whitney test. Data are representative of two independent experiments composed of 4-5 BALB/c mice per group. (B) Ear swelling for uninfected OVA and PBS sensitized mice on C57BL/6 background, including IgE deficient, mast cell deficient (Wsh), and C57BL/6 control mice. Data are representative of two independent experiments composed of three animals per group. (C) Ear swelling for uninfected OVA and PBS sensitized mice on BALB/c background, including antibody deficient JH and BALB/c control mice. Basophils and CD4 cells were depleted from BALB/c mice by administration of anti-CD200R and anti-CD4, respectively, 24 hours prior to challenge. Depletion was confirmed 72 hours post-challenge by flow cytometry. Data are representative of two independent experiments composed of three animals per group. Δ Thickness represents differences in ear thickness between PBS and OVA challenged ears (OVA-PBS) for each animal. (D) Visualization of immune complexes in OVA sensitized BALB/c mice by immunohistochemistry 3 hours after PBS or OVA challenge by staining with anti-mouse IgG-FITC. Error bars represent ± SEM. *p < 0.05, ** p < 0.01, ***p < 0.001.
Figure 3
Figure 3
Chronic L. sigmodontis infection does not alter immune complex morphology. Immunohistochemistry was performed on ears 3 hours after OVA challenge. Ear sections were stained with DAPI, anti-mouse IgG-Texas Red and anti-mouse C3-FITC to visualize immune complexes. Data are from two independent experiments with 2-3 BALB/c mice per group. (A) Representative images taken with a Zeiss 710 confocal microscope at 10X with 50% zoom to show detail. For each animal, the entire ear was imaged and analyzed using the Puncta Analyzer plugin on ImageJ. (B) Average size of IgG only, C3 only, and co-localized complexes. (C) Number of IgG only, C3 only, and co-localized complexes.
Figure 4
Figure 4
Chronically infected animals had reduced levels of allergen-specific antibodies. Levels of circulating total IgG (A), total IgG2a (B), OVA-specific IgG2a (C), and OVA-specific IgG1 were detected by ELISA at 10 weeks post-infection. ELISPOT assays for total IgG2a (E) and OVA-specific IgG2a (F) were performed on live, frozen splenocytes that were isolated from animals at the 10 week time point. Data are representative of two independent experiments with 4-5 BALB/c mice per group. Statistical differences between Sensitized and Sensitized + Infected groups were determined by the Mann Whitney test. *p < 0.05, ** p < 0.01.
Figure 5
Figure 5
Sensitized + Infected animals exhibited reduced ear pathology 24 hours post-challenge. (A) H&E stain of ear tissue at 3 hours post-challenge, the time point at which immune complexes were detected by immunohistochemistry. (B) Pathology score for 3 hour time point. Four parameters were measured (hemorrhaging, edema, necrosis, and cellularity) on the basis of severity (0-absent, 1-mild, 2-moderate, or 3-severe) and focality (0-absent, 1-focal, 2-intermediate, and 3-diffuse) for a total maximum score of 24. (C) H&E stain of ear tissue 24 hours post-challenge, the time point at which there was the greatest difference in ear swelling between groups. (D) Pathology score for 24 hour time point. Data are representative of two independent experiments with 3-4 BALB/c mice per group. Statistical differences between groups were analyzed by the Mann Whitney test. ** p < 0.01.
Figure 6
Figure 6
Sensitized + Infected animals showed impaired neutrophil and macrophage recruitment to the ear following allergen challenge. (A) 24 hours after OVA challenge, a single cell suspension ear tissue was generated and live cell counts were obtained by hemacytometer. Flow cytometry was then performed on the cell suspensions to determine the number of (B) neutrophils [F4/80Ly6G+], (C) macrophages [F4/80+], (D) eosinophils [CD11cCD45+SiglecF+], (E) dendritic cells [CD11c+], and (F) B cells [CD19+] present. Gates were determined using fluorescence minus one controls. Data are representative of two independent experiments with 4-5 BALB/c mice per group. Statistical differences between groups were analyzed by the Mann Whitney test. ** p < 0.01, *** p < 0.001, **** p < 0.0001.
Figure 7
Figure 7
Neutrophil-specific chemokine production by eosinophils was reduced in Sensitized + Infected animals. (A) Chemokine array performed on ear tissue 6 hours after OVA challenge. Both ears were challenged with OVA and pooled for each animal. Tissues were homogenized with FastPrep lysing matrix D beads in the presence of protease inhibitors, and supernatants assayed for the presence of 25 distinct chemokines. To determine the cell types responsible for neutrophil-specific chemokine production, macrophages were isolated from the peritoneal cavity and an eosinophil-enriched cell fraction was derived from splenocytes. Cells were stimulated with immune complexes for 6 hours in vitro and supernatants were harvested to assess macrophage production of CXCL-1 (B) and CXCL-2 (C), and eosinophil production of CXCL-1 (D) and CXCL-2 (E) by ELISA. Data are representative of two independent experiments with 4-5 BALB/c mice per group. (F) Ear swelling for uninfected OVA sensitized eosinophil-deficient ΔdblGATA (BALB/c background) and control BALB/c mice. Data are representative of two independent experiments composed of 3 animals per group. Error bars represent ± SEM. Significant differences between groups were analyzed by the Mann Whitney test. *p < 0.05, ** p < 0.01, ***p < 0.001.
Figure 8
Figure 8
Infection results in decreased percentage of eosinophils expressing FcγRI. Flow cytometry was used to assess the percentage of cells expressing activating Fc gamma receptors I and III, and inhibitory Fc gamma receptor II. Single cell suspensions of live splenocytes were first gated as (A) eosinophils [CD11cCD45+SiglecF+], (B) macrophages [F4/80+], (C) neutrophils [F4/80Ly6G+], (D) dendritic cells [CD11c+], or (E) B cells [CD19+]. Each cell type was then gated on the basis of FcγRI [CD64+], FcγRIII [CD16+] and FcγRII [CD32+] positivity using fluorescence minus one (FMO) controls. Data are representative of two independent experiments with 4-5 BALB/c mice per group. Error bars represent ± SEM. Significant differences between groups were analyzed by the Mann Whitney test. ****p < 0.0001.

Similar articles

Cited by

References

    1. Bager P, Arnved J, Rønborg S, Wohlfahrt J, Poulsen LK, Westergaard T, Petersen HW, Kristensen B, Thamsborg S, Roepstorff A, Kapel C, Melbye M. Trichuris suis ova therapy for allergic rhinitis: a randomized, double-blind, placebo-controlled clinical trial. J. Allergy Clin. Immunol. 2010;125:123–130. - PubMed
    1. Feary JR, Venn AJ, Mortimer K, Brown AP, Hooi D, Falcone FH, Pritchard DI, Britton JR. Experimental hookworm infection: a randomized placebo-controlled trial in asthma. Clin. Exp. Allergy. 2010;40:299–306. - PMC - PubMed
    1. Evans H, Mitre E. Worms as therapeutic agents for allergy and asthma: Understanding why benefits in animal studies have not translated into clinical success. J. Allergy Clin. Immunol. 2015;135:343–353. - PubMed
    1. Hoffmann W, Petit G, Schulz-Key H, Taylor D, Bain O, Le Goff L. Litomosoides sigmodontis in mice: Reappraisal of an old model for filarial research. Parasitol. Today. 2000;16:387–389. - PubMed
    1. Pfaff AW, Schulz-Key H, Soboslay PT, Taylor DW, MacLennan K, Hoffmann WH. Litomosoides sigmodontis cystatin acts as an immunomodulator during experimental filariasis. Int. J. Parasitol. 2002;32:171–178. - PubMed

Publication types

MeSH terms

LinkOut - more resources