. 2015 Sep 15;112(37):11636-41.
doi: 10.1073/pnas.1514954112. Epub 2015 Aug 31.

miR-15b/16-2 deletion promotes B-cell malignancies

Affiliations

miR-15b/16-2 deletion promotes B-cell malignancies

Francesca Lovat et al. Proc Natl Acad Sci U S A. .

Abstract

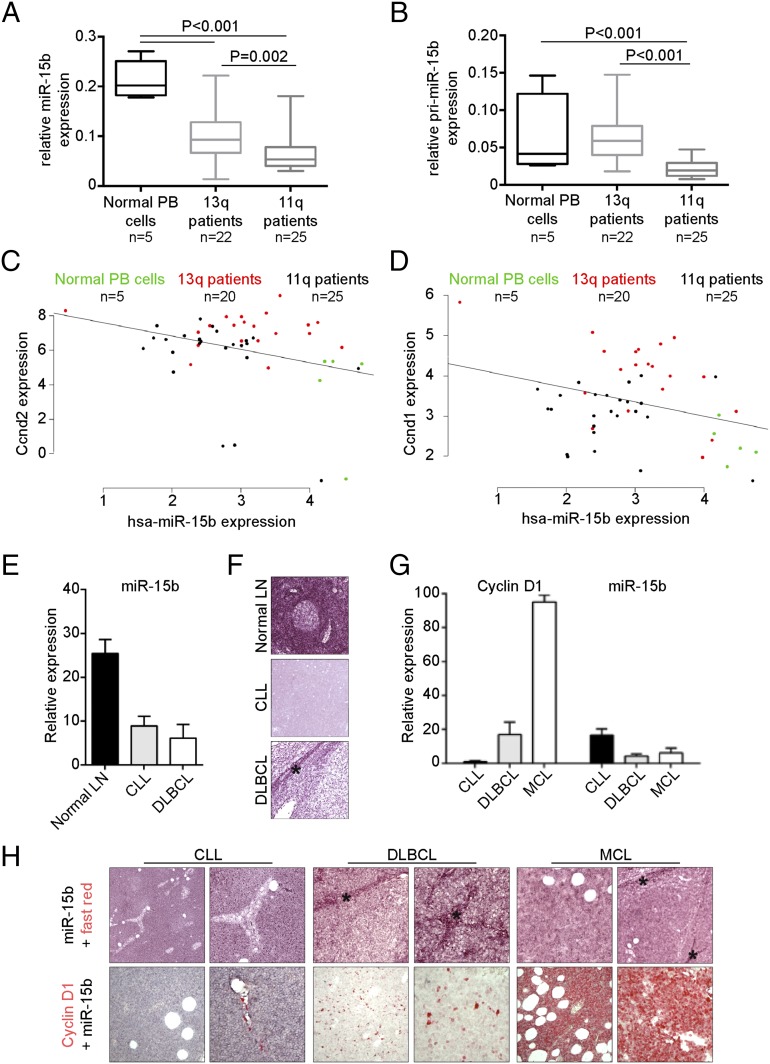
The central role of the microRNA (miR) 15a/16-1 cluster in B-cell oncogenesis has been extensively demonstrated, with over two-thirds of B-cell chronic lymphocytic leukemia characterized by the deletion of the miR-15a/16-1 locus at 13q14. Despite the well-established understanding of the molecular mechanisms occurring during miR-15a/16-1 dysregulation, the oncogenic role of other miR-15/16 family members, such as the miR-15b/16-2 cluster (3q25), is still far from being elucidated. Whereas miR-15a is highly similar to miR-15b, miR-16-1 is identical to miR-16-2; thus, it could be speculated that both clusters control a similar set of target genes and may have overlapping functions. However, the biological role of miR-15b/16-2 is still controversial. We generated miR-15b/16-2 knockout mice to better understand the cluster's role in vivo. These mice developed B-cell malignancy by age 15-18 mo with a penetrance of 60%. At this stage, mice showed significantly enlarged spleens with abnormal B cell-derived white pulp enlargement. Flow cytometric analysis demonstrated an expanded CD19+ CD5+ population in the spleen of 40% knockout mice, a characteristic of the chronic lymphocytic leukemia-associated phenotype found in humans. Of note, miR-15b/16-2 modulates the CCND2 (Cyclin D2), CCND1 (Cyclin D1), and IGF1R (insulin-like growth factor 1 receptor) genes involved in proliferation and antiapoptotic pathways in mouse B cells. These results are the first, to our knowledge, to suggest an important role of miR-15b/16-2 loss in the pathogenesis of B-cell chronic lymphocytic leukemia.

Keywords: B cells; chronic lymphocytic leukemia; miR-15b; miRNAs; murine models.


Conflict of interest statement

The authors declare no conflict of interest.

Figures

Fig. 1.
Fig. 1.
Deletion of miR-15b/16-2 in mice. (A) Schematic representation of the miR-15b/16-2 targeting strategy. (B) Northern blot analysis showing robust down-regulation of miR-15b but not of miR-16 in spleens from knockout mice compared with spleens from wild-type mice. Noncoding small nuclear RNA U6 was used as a loading control. (C) qRT-PCR analysis of spleens from knockout mice showing miR-15b down-regulation but not for miR-16 compared with wild-type mice. (D) Survival curve of the miR-15b/16-2 knockout cohort. Mice were followed for 24 mo (730 days) and events were corresponded to mice that died due to illness or those identified as sick (with palpable tumor mass) and then euthanized (P < 0.001). The number of mice in each group is indicated.
Fig. S1.
Fig. S1.
Deletion of miR-15b/16-2 in mice. (A) Southern blot analysis of wild-type, knockout, and heterozygous (HET) mice. The expected fragments after BamHI digestion are indicated. (B) PCR analysis of wild-type, knockout, and heterozygous mice. The expected bands are indicated. (CF) Southern blot analysis of colons (C) and lungs (E) from knockout and wild-type mice. Noncoding small nuclear RNA U6 was used as a loading control. qRT-PCR analysis of colons (D) and lungs (F) from knockout and wild-type mice. Small nucleolar RNAs snoR-292 and snoR-135 were used for normalization.
Fig. 2.
Fig. 2.
Histological analysis of spleens from wild-type and knockout mice. (A and B) Spleens from knockout mice were enlarged up to fourfold in volume compared with spleens from wild-type mice. (C) H&E (Top) and B220 (Middle) -stained spleen sections from knockout mice show B cell-derived white pulp enlargement with follicular structure disruption (dashed outline) compared with wild-type mice. Wright–Giemsa-stained blood smear (Bottom) shows an increase of small lymphocytes from a knockout mouse compared with a wild-type mouse. (Scale bars: A, 1 cm; C, Upper Left WT and KO, 250 μm; Upper Right WT and KO, 50 μm; Middle WT and KO, 250 μm.) Error bars represent SD.
Fig. 3.
Fig. 3.
miR-15b/16-2 knockout mice develop lymphoproliferative disease. (A) Percentage of B-lymphoid pathologies from knockout mice up to 24 mo old. The number of mice analyzed is indicated. CLL/SLL, chronic lymphocytic leukemia and small lymphocytic lymphoma; MBL, monoclonal B-cell lymphocytosis; NHL, non-Hodgkin B-cell lymphoma. (B) H&E sections of bone marrow and superficial cervical/inguinal lymph node from knockout mice show a nodular infiltration (asterisks) of small lymphocytes. (C and D) Gross pathology of spleen, kidney, and liver (C; scale bar: 1 cm) and H&E sections of salivary gland, kidney, and liver (D) from knockout mice show extensive lymphoma infiltration (asterisks). (E) White blood cells from spleens and bone marrow of knockout and wild-type mice were analyzed by flow cytometry. The plot represents the percentage of CD5+ CD19+ cells among white blood cells still alive. The number of mice analyzed and the P values are indicated. Error bars represent SD. (F) Representative flow cytometry analysis of spleens and bone marrow from knockout and wild-type mice. (Scale bar: C, 1 cm.) SSC-H, side scatter versus FSC-H forward scatter.
Fig. S2.
Fig. S2.
Analysis of miR-15b/16-2 targets in miR-15b/16-2–deleted mouse B cells. (A) Western blot analysis of IGF1R and BCL2 expression in B cells from knockout and wild-type mice after LPS stimulation at the indicated time points. Fold change in protein expression is indicated. β-Actin was used as a loading control. (B and C) Western blot analysis of IGF1R expression in B cells from knockout and wild-type mice. β-Actin was used as a loading control. Fold change in protein expression is shown in the histogram. (D) Positions of miR-15b putative binding sites on the CCND2 and IGF1R transcripts and their mutants. (E) psiCHECK-2 vector with the IGF1R WT 3′ UTR insert and Mut miR-15b 3′ UTR containing a deletion of the miR-15b target site in the 3′ UTR was cotransfected with miR-15b or scrambled miR in 293HEK cells. Luciferase activity was recorded after 24 h. Data represent the mean ± SD from at least three independent experiments.
Fig. 4.
Fig. 4.
Analysis of miR-15b/16-2 targets in miR-15b/16-2–deleted mouse B cells. (A) Western blot analysis of Cyclin D2 expression in B cells from knockout and wild-type mice after LPS stimulation at the indicated time points. β-Actin was used as a loading control. Fold change in protein expression is indicated. hs, hours. (B) Western blot analysis of Cyclin D2 and Cyclin D1 expression in B cells from knockout and wild-type mice. β-Actin was used as a loading control. (C) Relative quantification of Cyclin D1 and Cyclin D2 expression to the β-actin loading control in B cells from knockout and wild-type mice. (D) psiCHECK-2 vector with the CCND2 WT 3′ UTR insert and Mut miR-15b 3′ UTR (mut1, mut2, and mut3) containing a deletion of the miR-15b target site in the 3′ UTR was cotransfected with miR-15b or scrambled miR in 293HEK cells. Luciferase activity was recorded after 24 h. Data represent the mean ± SD from at least three independent experiments.
Fig. 5.
Fig. 5.
miR-15b/16-2 expression in human CLL samples. (A and B) qRT-PCR analysis of miR-15b (A) and pri-miR-15b (B) in CLL samples. The number of patients analyzed and the P values are indicated. (C and D) Correlations between miR-15b and Cyclin D2 (C) or Cyclin D1 (D) expression were determined using the Spearman coefficient in normal and CLL samples (Cyclin D2: n = 50, P = 0.038; Cyclin D1: n = 50, P = 0.021). hsa, human. (E and F) ISH for miR-15b in human normal lymph node (LN) and CLL and DLBCL samples and quantification. (G and H) ISH for miR-15b (H, Upper) and miR-15b and Cyclin D1 (H, Lower) in human CLL, DLBCL, and MCL samples (asterisks indicate normal lymph node remnants showing moderate miR-15b expression). (G) Quantification of miR-15b and Cyclin D1 expression in CLL, DLBCL, and MCL samples. Error bars represent SD.
Fig. S3.
Fig. S3.
miR-15b/16-2 expression in human CLL samples. (A) Correlations between miR-15b and Cyclin D2 (Left) or Cyclin D1 (Right) expression were determined using Spearman coefficient CLL samples from the TCGA database (Cyclin D2: P = 0.004; Cyclin D1: P = 0.027). (B) ISH for miR-15b in human normal lymph node and CLL and DLBCL samples (asterisks indicate normal lymph node remnants showing moderate miR-15b expression).

References

    1. Ambros V. The functions of animal microRNAs. Nature. 2004;431(7006):350–355. - PubMed
    1. Calin GA, et al. A microRNA signature associated with prognosis and progression in chronic lymphocytic leukemia. N Engl J Med. 2005;353(17):1793–1801. - PubMed
    1. Cimmino A, et al. miR-15 and miR-16 induce apoptosis by targeting BCL2. Proc Natl Acad Sci USA. 2005;102(39):13944–13949. - PMC - PubMed
    1. Aqeilan RI, Calin GA, Croce CM. miR-15a and miR-16-1 in cancer: Discovery, function and future perspectives. Cell Death Differ. 2010;17(2):215–220. - PubMed
    1. Calin GA, et al. Frequent deletions and down-regulation of micro-RNA genes miR15 and miR16 at 13q14 in chronic lymphocytic leukemia. Proc Natl Acad Sci USA. 2002;99(24):15524–15529. - PMC - PubMed

Publication types

LinkOut - more resources