. 2015 Sep 15;112(37):11714-9.
doi: 10.1073/pnas.1511701112. Epub 2015 Aug 31.

Noncanonical role of transferrin receptor 1 is essential for intestinal homeostasis

Affiliations

Noncanonical role of transferrin receptor 1 is essential for intestinal homeostasis

Alan C Chen et al. Proc Natl Acad Sci U S A. .

Abstract

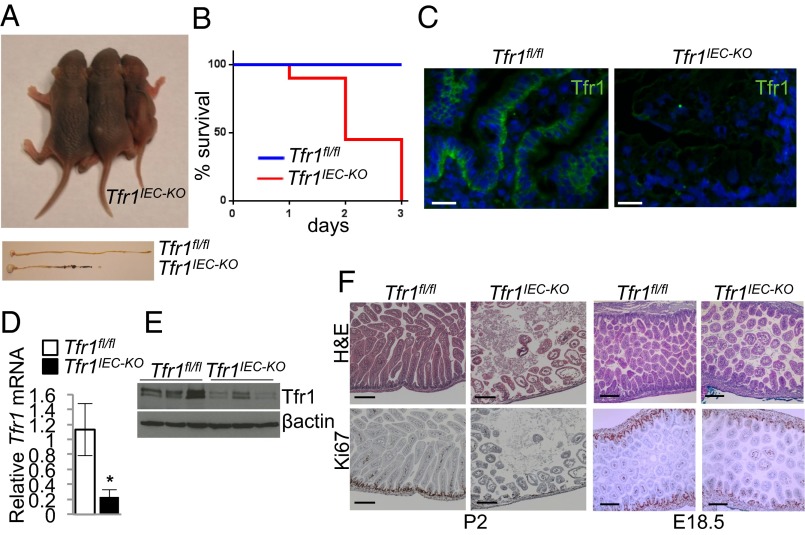
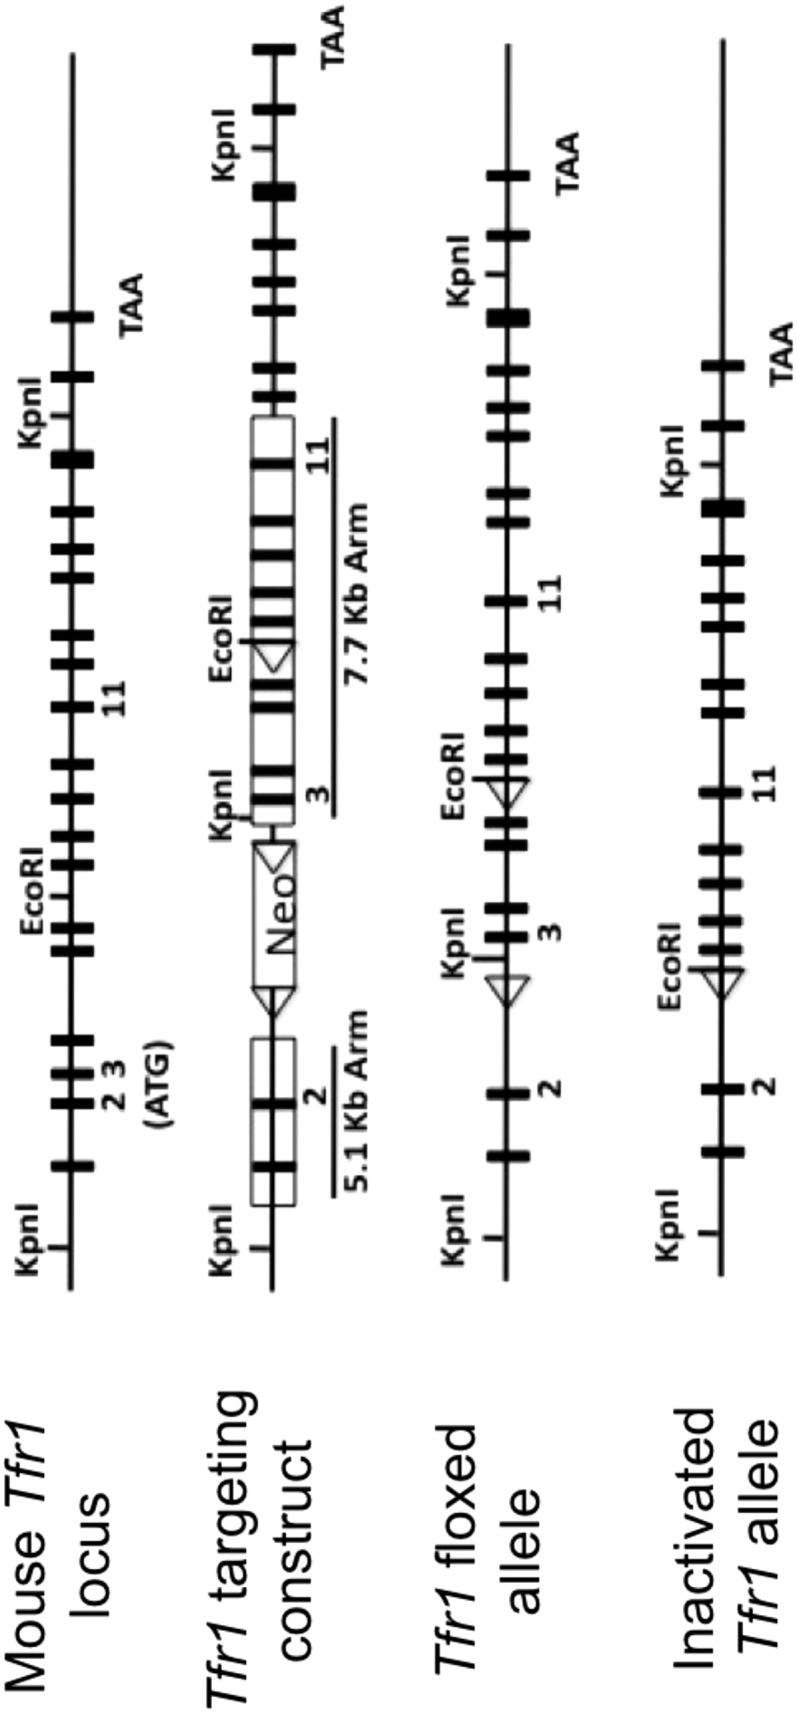
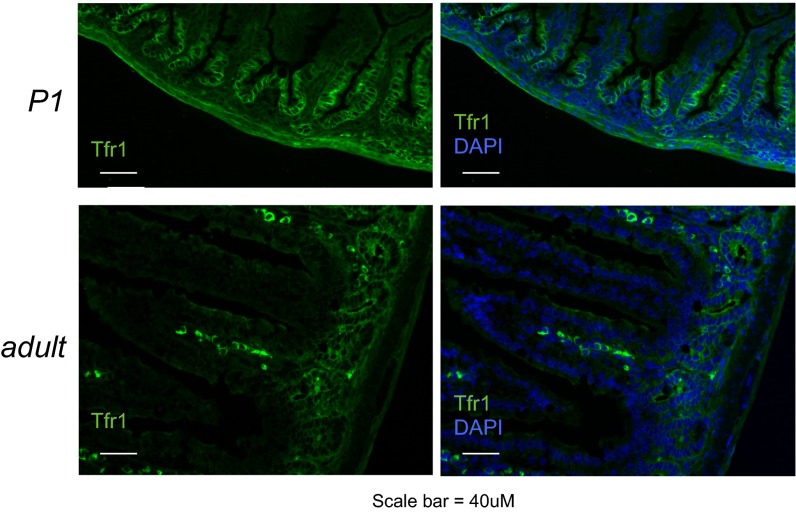
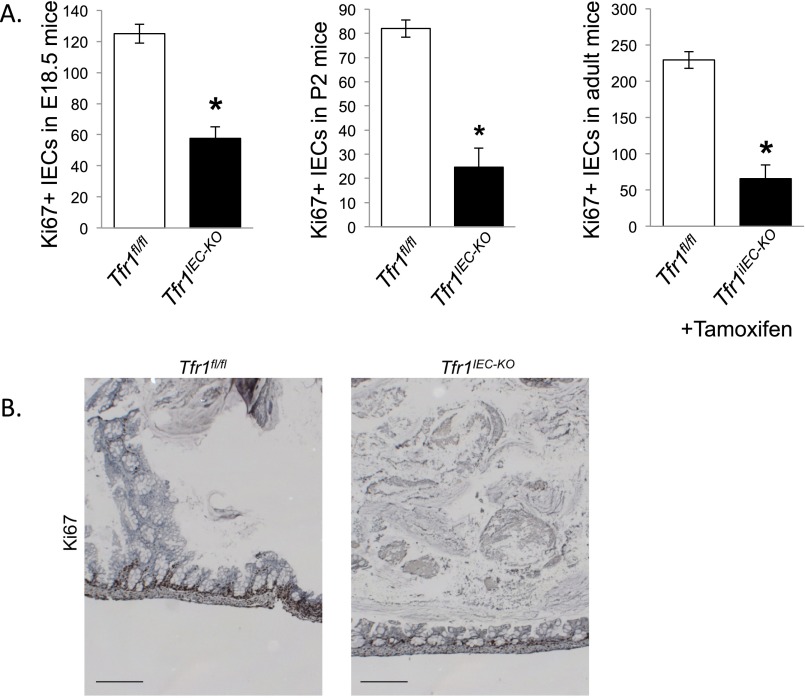
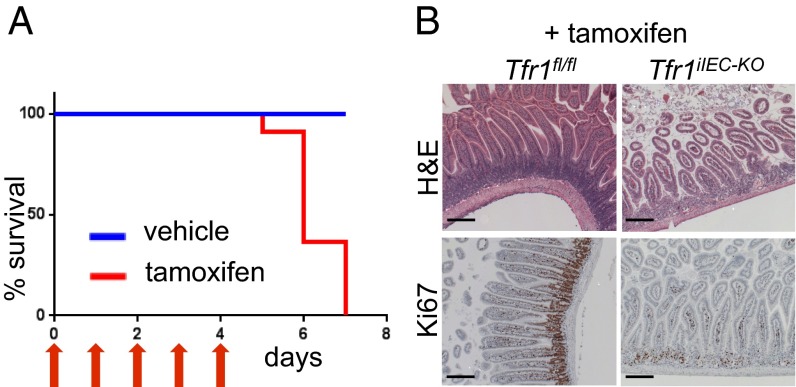
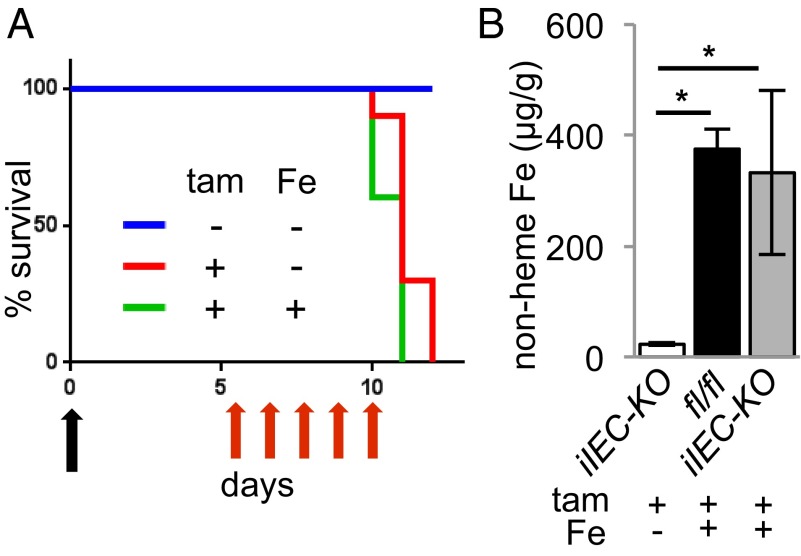
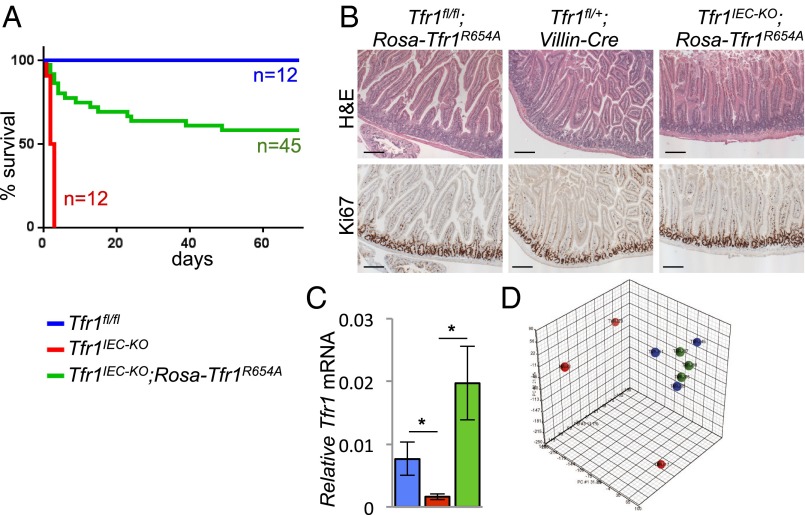
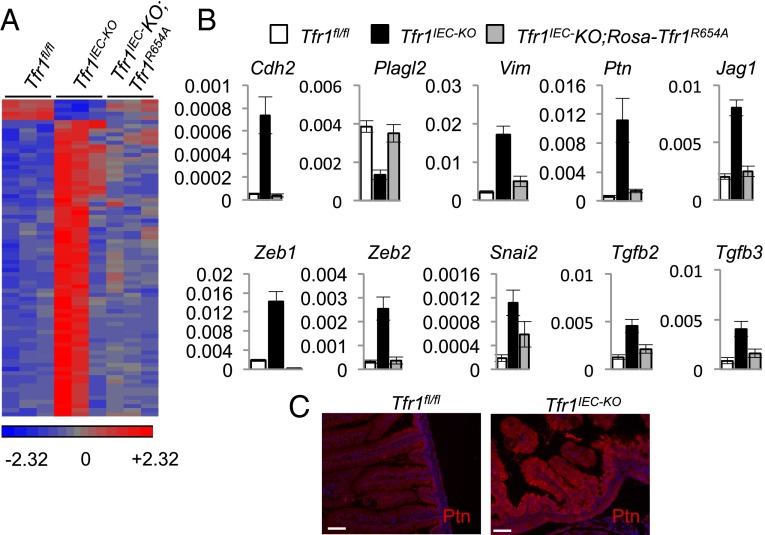
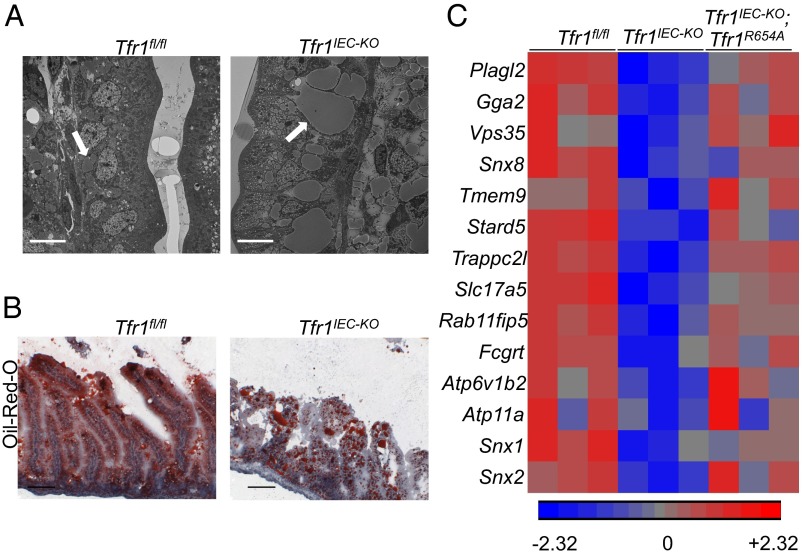
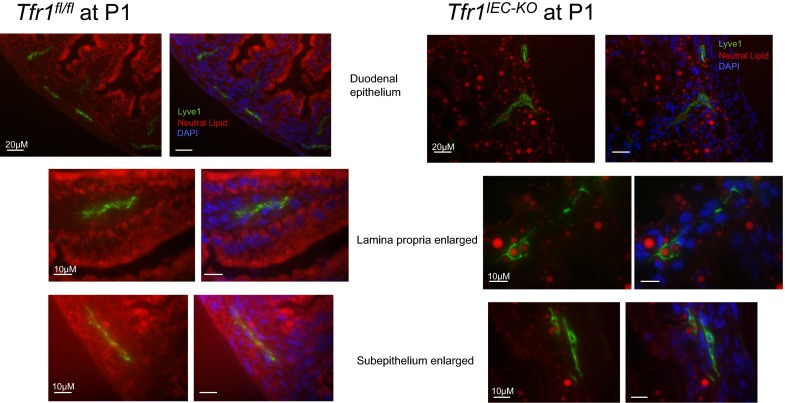
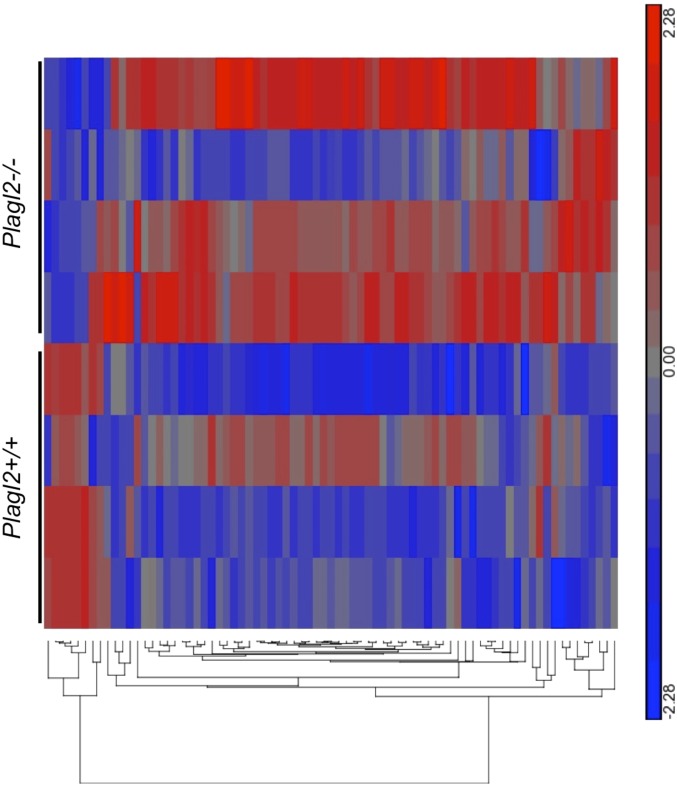
Transferrin receptor 1 (Tfr1) facilitates cellular iron uptake through receptor-mediated endocytosis of iron-loaded transferrin. It is expressed in the intestinal epithelium but not involved in dietary iron absorption. To investigate its role, we inactivated the Tfr1 gene selectively in murine intestinal epithelial cells. The mutant mice had severe disruption of the epithelial barrier and early death. There was impaired proliferation of intestinal epithelial cell progenitors, aberrant lipid handling, increased mRNA expression of stem cell markers, and striking induction of many genes associated with epithelial-to-mesenchymal transition. Administration of parenteral iron did not improve the phenotype. Surprisingly, however, enforced expression of a mutant allele of Tfr1 that is unable to serve as a receptor for iron-loaded transferrin appeared to fully rescue most animals. Our results implicate Tfr1 in homeostatic maintenance of the intestinal epithelium, acting through a role that is independent of its iron-uptake function.

Keywords: epithelial–mesenchymal transition; homeostasis; intestinal epithelium; stem cell; transferrin receptor.


Conflict of interest statement

The authors declare no conflict of interest.

Figures

Fig. 1.
Fig. 1.
Neonatal lethality. (A) P1 neonates. Two Tfr1fl/fl control mice on left; Tfr1IEC-KO mouse on right. (Lower) P1 stomach (Left), small intestine and colon; genotypes indicated. (B) Survival of neonates (Tfr1fl/fl n = 12; Tfr1IEC-KO n = 12). (C) Immunofluorescence localization of Tfr1 (green) and DAPI (blue) in P0 duodenum showed Tfr1 on the basolateral surface of Tfr1fl/fl intervillous IECs and absent from Tfr1IEC-KO IECs. (Scale bars, 20 μM.) See also Fig. S2. (D) Tfr1 mRNA expression, relative to Rpl19, determined by qRT-PCR (*P < 0.05, n = 3 each). (E) Tfr1 protein; β-actin control. (F, Upper) H&E staining of P2 (Left) and E18.5 (Right) duodenal sections showed blunted villi, smaller intervillous regions, and edema in Tfr1IEC-KO mice. (Lower) reduced Ki67 staining in Tfr1IEC-KO mice relative to Tfr1fl/fl controls at both ages. (Scale bars, 200 μM.) See Fig. S3A for quantitation of Ki67 staining.
Fig. S1.
Fig. S1.
Strategy used to develop floxed Tfr1 allele. The mouse Tfr1 locus is shown at top. A targeting construct was introduced into ES cells to insert three loxP sites (triangles) including two flanking a neomycin-resistance cassett (Neo) in intron 2. As described in Materials and Methods, Cre recombinase was used to recombine the allele in vivo to produce the Tfr1 floxed allele with 2 remaining loxP sites flanking exons 3–6. In the presence of Cre recombinase there is further recombination resulting in the inactivated Tfr1 allele lacking exons 3–6.
Fig. S2.
Fig. S2.
Localization of Tfr1 in control mice (supplemental to Fig. 1C). Immunofluorescence localization of Tfr1 in P0 and adult mice. In newborn mice, Tfr1 localizes primarily to the basolateral surface of intervillous IECs. In adult mice, Tfr1 is confined to the basolateral surface of crypt cells.
Fig. S3.
Fig. S3.
Ki67 staining (supplemental to Figs. 1F and 2B). (A) Ki67+ IECs were counted in five fields from 3 Tfr1fl/fl and Tfr1IEC-KO mice at E18.5 and P2 and from three Tfr1fl/fl and Tfr1iIEC-KO tamoxifen treated 2-mo-old mice. Ages are shown on the y axis. *P < 0.005 by Student’s t test. Values represent mean ± SEM. (B) The figure shows general morphological changes and decreased Ki67 staining in colonic crypts in Tfr1IEC-KO mice. (Scale bars, 200 μM.)
Fig. 2.
Fig. 2.
Tfr1 is required for adult intestinal epithelial homeostasis. (A) Survival of 2-mo-old control (n = 10) and tamoxifen-treated Tfr1iIEC-KO mice (n = 10). Daily tamoxifen injections shown with red arrows. (B) H&E staining showed disruption of the duodenal epithelium in adult Tfr1iIEC-KO mice (Upper). Ki67 staining showed reduction of proliferating IECs in Tfr1iIEC-KO mice (Lower). (Scale bars, 200 μM.) See Fig. S3A for quantitation of Ki67 staining.
Fig. 3.
Fig. 3.
Iron-loading does not rescue viability. (A) Survival of iron-preloaded mice treated with tamoxifen. A single dose of iron-dextran was given (black arrow). Daily injections of tamoxifen (tam) were given as indicated (red arrows). All animals in this experiment carried the floxed Tfr1 allele and inducible Cre recombinase; treatments as shown in the legend; blue n = 10, red n = 10, green n = 8. (B) Nonheme iron content of IECs, normalized by tissue wet weight; genotypes and treatments indicated (*P < 0.001, n = 3 each).
Fig. 4.
Fig. 4.
Tfr1R654A rescues Tfr1IEC-KO mice. The color key is used throughout this figure. (A) Survival curves showed rescue of most Tfr1IEC-KO;Rosa26-Tfr1R654A/+ mice. (B) H&E staining of duodenum from 2-mo-old Tfr1fl/fl;Rosa26-Tfr1R654A/+ and Tfr1IEC-KO;Rosa26-Tfr1R654A/+ mice showed rescue of epithelial integrity (Upper). Ki67 staining at 2 mo showed normal IEC proliferation in rescued crypts (Lower). (Scale bars, 200 μM.) (C) Relative Tfr1 mRNA expression by qRT-PCR (*P < 0.05, n = 3 Tfr1fl/fl, n = 9 Tfr1IEC-KO, n = 4 Tfr1IEC-KO;Rosa26Tfr1R654A/+). (D) Principal component analysis of P0 IEC gene expression from Tfr1fl/fl, Tfr1IEC-KO, and Tfr1IEC-KO;Rosa26Tfr1R654A/+ mice (n = 3 each). Samples from Tfr1fl/fl and Tfr1IEC-KO;Rosa26Tfr1R654A/+ mice are tightly clustered (blue and green). One Tfr1IEC-KO (red) outlier is apparent toward the bottom.
Fig. 5.
Fig. 5.
Induction of EMT-associated genes. (A) Heat map representing expression of EMT-associated genes ascertained by microarray profiling of IECs at P0 (samples correspond to Fig. 4D). Color code (arbitrary scale) is at bottom. A list of genes in the same order is given in Table S2. (B) Expression of a subset of EMT-associated genes was validated using qRT-PCR (see Table S4 for primers used) with Tfr1fl/fl (n = 6), Tfr1IEC-KO (n = 9), and Tfr1IEC-KO;Rosa26Tfr1R654A/+ (n = 6) P0 IECs; key shown at top. Expression was normalized to Rpl19. All differences between Tfr1IEC-KO and the other genotypes have P < 0.05, Student’s t test. Values represent mean ± SEM. (C) Immunofluorescence detection of increased pleiotrophin (Ptn) protein in Tfr1IEC-KO IECs. Nuclei were stained with DAPI. (Scale bars, 20 μM.)
Fig. 6.
Fig. 6.
Altered lipid metabolism in Tfr1IEC-KO IECs. (A) Electron micrographs showed large inclusions in IECs of Tfr1IEC-KO intestinal epithelium and similar, smaller inclusions in Tfr1fl/fl epithelium at P1 (white arrows). (Scale bars, 10 μM.) (B) Oil-red-O staining of P1 intestinal epithelium confirming that inclusions, seen as large red spots in Tfr1IEC-KO IECs, contain neutral lipids. Staining was more diffuse in Tfr1fl/fl IECs. (Scale bars, 100 μM.) See Fig. S4 for additional detail. (C) Heat map of genes reported to be down-regulated in Plagl2−/− mice (28), from microarray profiles of Tfr1fl/fl, Tfr1IEC-KO, and Tfr1IEC-KO;Rosa26-Tfr1R654A/+ IECs.
Fig. S4.
Fig. S4.
Neutral fat in lymphatic vessels (supplemental to Fig. 6). Neutral lipid in the lacteal system was detected by fixing frozen sections in 4% paraformaldehyde and costaining with human anti-mouse Lyve-1 conjugated to Alexafluor 488 (eBioscience) and LipidTOX Red Neutral Lipid Stain (Life Technologies). DAPI stain was used to identify nuclei to discern villous structure.
Fig. S5.
Fig. S5.
EMT gene expression in Plagl2−/− mice. The dataset described by Van Dyck et al. (26) is publically available. Considering that Tfr1IEC-KO animals showed expression of lipid-related genes that was similar to that described in Plagl2−/− mice, we asked whether expression of EMT-related genes were similarly altered. As shown in this figure, it appeared that many were, though the pattern was not as striking as seen in Tfr1IEC-KO mice.

Similar articles

Cited by

References

    1. Hentze MW, Muckenthaler MU, Andrews NC. Balancing acts: Molecular control of mammalian iron metabolism. Cell. 2004;117(3):285–297. - PubMed
    1. Levy JE, Jin O, Fujiwara Y, Kuo F, Andrews NC. Transferrin receptor is necessary for development of erythrocytes and the nervous system. Nat Genet. 1999;21(4):396–399. - PubMed
    1. Ned RM, Swat W, Andrews NC. Transferrin receptor 1 is differentially required in lymphocyte development. Blood. 2003;102(10):3711–3718. - PubMed
    1. Trenor CC, 3rd, Campagna DR, Sellers VM, Andrews NC, Fleming MD. The molecular defect in hypotransferrinemic mice. Blood. 2000;96(3):1113–1118. - PubMed
    1. Schmidt PJ, Toran PT, Giannetti AM, Bjorkman PJ, Andrews NC. The transferrin receptor modulates Hfe-dependent regulation of hepcidin expression. Cell Metab. 2008;7(3):205–214. - PMC - PubMed

Publication types

MeSH terms

Associated data