. 2015 Sep 15;112(37):11484-9.
doi: 10.1073/pnas.1422945112. Epub 2015 Aug 31.

Substantial increase in concurrent droughts and heatwaves in the United States

Affiliations

Substantial increase in concurrent droughts and heatwaves in the United States

Omid Mazdiyasni et al. Proc Natl Acad Sci U S A. .

Abstract

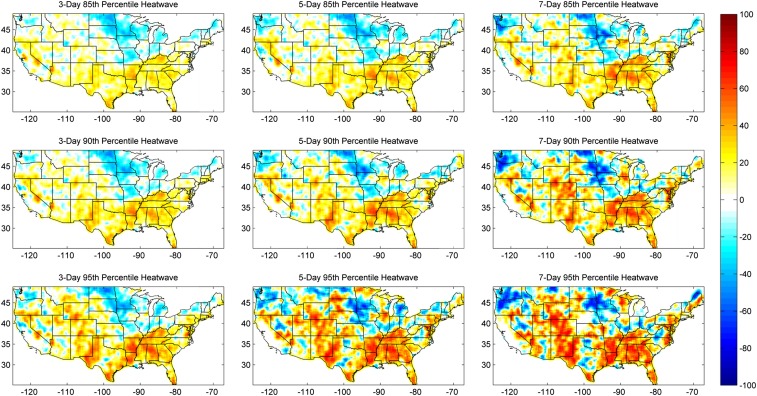
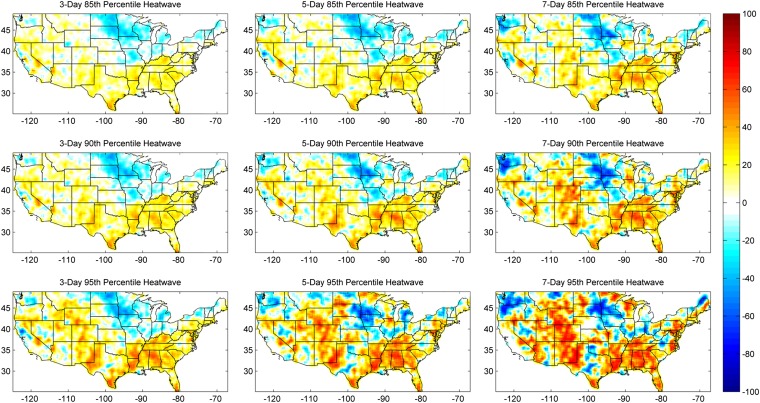
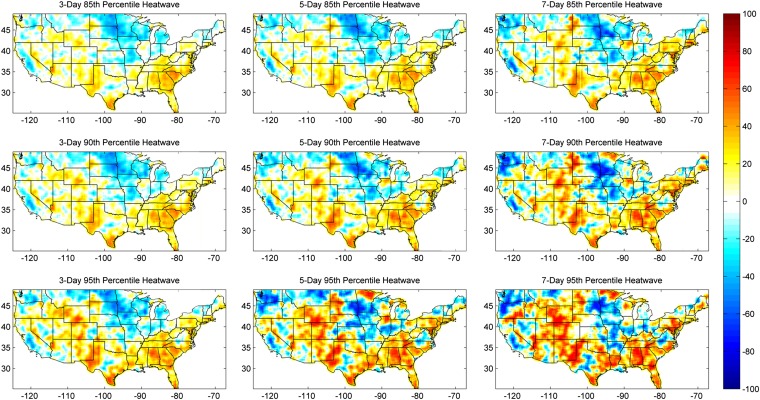
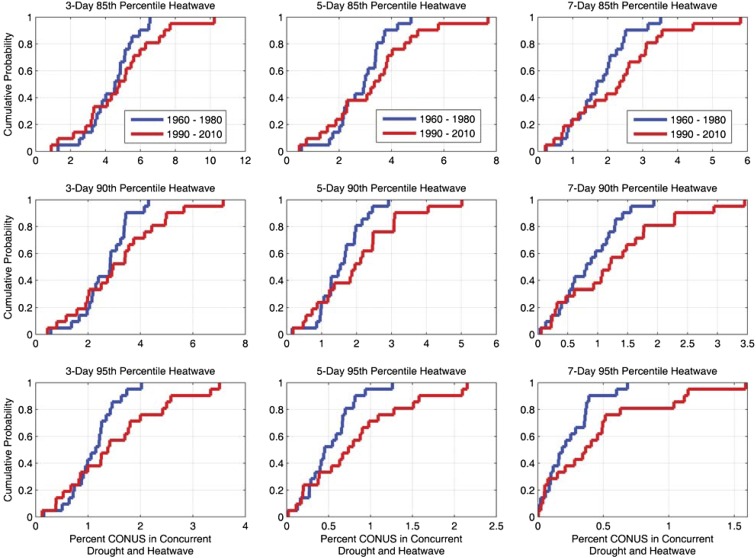
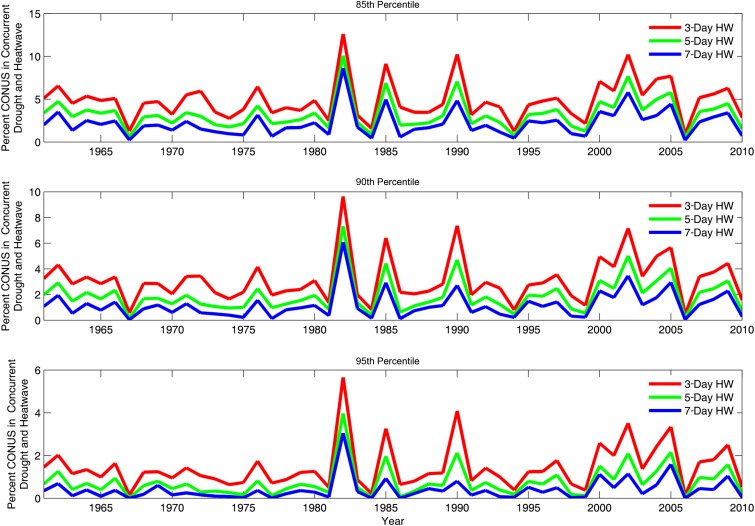
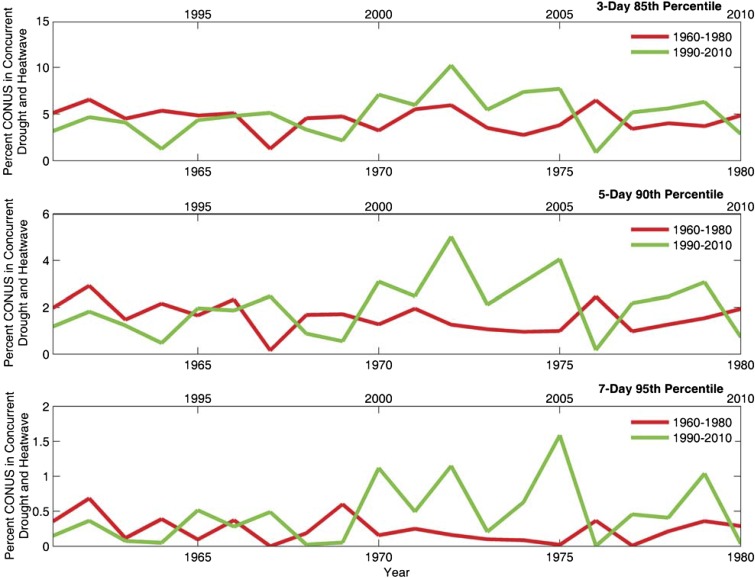
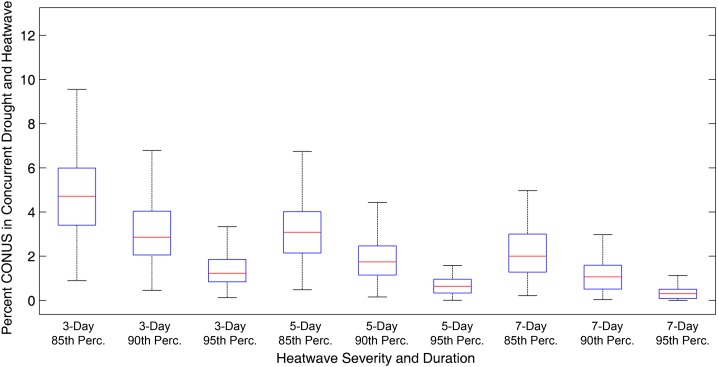
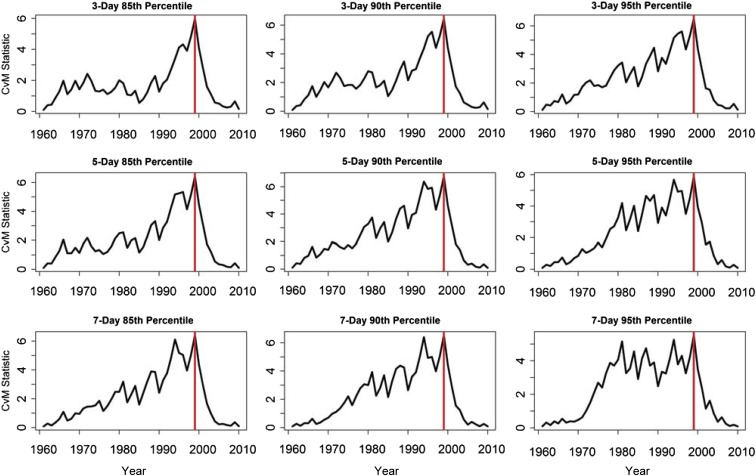
A combination of climate events (e.g., low precipitation and high temperatures) may cause a significant impact on the ecosystem and society, although individual events involved may not be severe extremes themselves. Analyzing historical changes in concurrent climate extremes is critical to preparing for and mitigating the negative effects of climatic change and variability. This study focuses on the changes in concurrences of heatwaves and meteorological droughts from 1960 to 2010. Despite an apparent hiatus in rising temperature and no significant trend in droughts, we show a substantial increase in concurrent droughts and heatwaves across most parts of the United States, and a statistically significant shift in the distribution of concurrent extremes. Although commonly used trend analysis methods do not show any trend in concurrent droughts and heatwaves, a unique statistical approach discussed in this study exhibits a statistically significant change in the distribution of the data.

Keywords: climate change; compound climate extremes; concurrent extremes; drought; heatwave.


Conflict of interest statement

The authors declare no conflict of interest.

Figures

Fig. 1.
Fig. 1.
Percent (%) change in concurrent droughts and heatwaves during 1990–2010 relative to 1960–1980 for each grid box. The rows change in heatwave severity (85th percentile, 90th percentile, and 95th percentile), and the columns change in heatwave duration (3 d, 5 d, and 7 d).
Fig. S1.
Fig. S1.
Percent (%) change in concurrent droughts (SPI < −0.5) and heatwaves during 1990–2010 relative to 1960–1980 for each grid box. The rows change in heatwave severity (85th percentile, 90th percentile, and 95th percentile), and the columns change in heatwave duration (3 d, 5 d, and 7 d).
Fig. S2.
Fig. S2.
Percent (%) change in concurrent droughts (3-mo SPI < −0.8) and heatwaves during 1990–2010 relative to 1960–1980 for each grid box. The rows change in heatwave severity (85th percentile, 90th percentile, and 95th percentile), and the columns change in heatwave duration (3 d, 5 d, and 7 d).
Fig. 2.
Fig. 2.
The empirical CDF of drought and heatwave concurrences from 1960 to 1980 (blue) and 1990 to 2010 (red). The x axes represent the percent (%) of CONUS in concurrent drought and heatwave (see SI Data Sources and Processing for more information on percent of CONUS). The rows change in heatwave severity (85th percentile, 90th percentile, and 95th percentile), and the columns change in heatwave duration (3 d, 5 d, and 7 d).
Fig. 3.
Fig. 3.
Percent (%) of CONUS in concurrent drought and heatwave from 1960 to 2010.
Fig. S3.
Fig. S3.
Percent (%) of CONUS in concurrent drought and heatwave from 1960 to 1980 (bottom x axes) relative to 1990–2010 (top x axes) for three different heatwave durations and severity thresholds.
Fig. S4.
Fig. S4.
Box plots of the percent (%) of CONUS in concurrent drought and heatwave from 1960 to 2010 (based on data presented in Fig. 3) for three different heatwave durations (3 d, 5 d, and 7 d) and severity thresholds (85th, 90th, 95th percentiles). The central marks (red lines) are the medians, and the edges of the boxes are the 25th and 75th percentiles. The whiskers show the most extreme values not identified as outliers.
Fig. 4.
Fig. 4.
The Cramér−von Mises (CvM) change point statistic from 1960 to 2010. The rows change in heatwave severity (85th percentile, 90th percentile, and 95th percentile), and the columns change in heatwave duration (3 d, 5 d, and 7 d). The red lines indicate the point of maximum divergence between the distributions of concurrent drought and heatwave events.
Fig. S5.
Fig. S5.
Autocorrelation function (ACF) of the time series used in Fig. 3. The dashed lines represent the 95% confidence intervals (0.05 significance level).

Similar articles

Cited by

References

    1. Easterling DR, et al. Climate extremes: Observations, modeling, and impacts. Science. 2000;289(5487):2068–2074. - PubMed
    1. Ciais P, et al. Europe-wide reduction in primary productivity caused by the heat and drought in 2003. Nature. 2005;437(7058):529–533. - PubMed
    1. Vautard R, et al. Simulation of ozone during the August 2003 heat wave and emission control scenarios. Atmos Environ. 2005;39(16):2957–2967.
    1. Seneviratne SI, et al. 2012. Changes in climate extremes and their impacts on the natural physical environment. Managing the Risks of Extreme Events and Disasters to Advance Climate Change Adaptation, eds Field CB, et al. (Cambridge Univ Press, New York), pp 109−230.
    1. Beniston M. The 2003 heat wave in Europe: A shape of things to come? An analysis based on Swiss climatological data and model simulations. Geophys Res Lett. 2004;31(2):L02202.

Publication types