. 2015 Sep 22;112(38):E5281-9.
doi: 10.1073/pnas.1511270112. Epub 2015 Aug 31.

Complexity of the human memory B-cell compartment is determined by the versatility of clonal diversification in germinal centers

Affiliations

Complexity of the human memory B-cell compartment is determined by the versatility of clonal diversification in germinal centers

Bettina Budeus et al. Proc Natl Acad Sci U S A. .

Abstract

Our knowledge about the clonal composition and intraclonal diversity of the human memory B-cell compartment and the relationship between memory B-cell subsets is still limited, although these are central issues for our understanding of adaptive immunity. We performed a deep sequencing analysis of rearranged immunoglobulin (Ig) heavy chain genes from biological replicates, covering more than 100,000 memory B lymphocytes from two healthy adults. We reveal a highly similar B-cell receptor repertoire among the four main human IgM(+) and IgG(+) memory B-cell subsets. Strikingly, in both donors, 45% of sequences could be assigned to expanded clones, demonstrating that the human memory B-cell compartment is characterized by many, often very large, B-cell clones. Twenty percent of the clones consisted of class switched and IgM(+)(IgD(+)) members, a feature that correlated significantly with clone size. Hence, we provide strong evidence that the vast majority of Ig mutated B cells--including IgM(+)IgD(+)CD27(+) B cells--are post-germinal center (GC) memory B cells. Clone members showed high intraclonal sequence diversity and high intraclonal versatility in Ig class and IgG subclass composition, with particular patterns of memory B-cell clone generation in GC reactions. In conclusion, GC produce amazingly large, complex, and diverse memory B-cell clones, equipping the human immune system with a versatile and highly diverse compartment of IgM(+)(IgD(+)) and class-switched memory B cells.

Keywords: IgM memory; IgV gene repertoire; clonal composition; human memory B cell subsets.


Conflict of interest statement

The authors declare no conflict of interest.

Figures
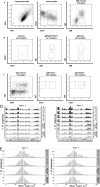
Fig. S1.
Fig. S1.
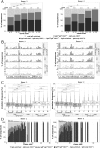
Cell sorting strategy of memory B-cell subpopulations. (A) IgM+IgD+CD27+ and IgM-only B cells are separated after enrichment of B cells by CD19 MACS according to their surface IgD level. CD27high plasmablasts are excluded. (B) Postsort analysis of IgM+IgD+CD27+ and IgM-only B cells from donor 1. (C) IgG+CD27+ and IgG+ CD27 B cells are defined by surface IgG and CD27 expression. Pre- and postsort analysis of donor 1 is shown. (D) The relative use of individual IGHV gene segments of families 1, 3, 4, and 7 among memory B-cell subpopulations and biological replicates is highly similar. Minor variations between subpopulations are detectable at similar ranges in biological replicates. No statistically significant differences are detectable between any two conditions among single IGHV genes with >5% frequency and greater than twofold change. The separator in each column marks the amount of sequences contributed by each allelic variant of the respective IGHV gene. (E) CDRIII length spectratyping reveals highly similar distributions between memory B-cell subpopulations. The separator in each column marks the amount of sequences contributed by each vial.
Fig. 1.
Fig. 1.
BCR repertoire and mutation analysis of human PB memory B-cell subsets. (A) The relative use of individual IGHV gene segments of families 1, 3, 4, and 7 among memory B-cell subpopulations shows highly similar patterns. Statistically significant differences between individual subsets are marked (*P < 0.05, **P < 0.01, ***P < 0.001; Fisher’s exact test). Test results were not corrected for multiple comparisons to estimate the maximum number of gene segments differing between B-cell subsets with the full specificity of Fisher's exact test. Only IGHV gene segments comprising at least 5% of total sequences in at least one condition and showing at least twofold difference in frequency between two B-cell subsets were considered. The separator in each column marks the amount of sequences contributed by each vial. (B) IGHV gene mutation frequencies (mutations/100 bp) of memory B-cell subsets are distinct. Median values (black bars) are given as numbers, and box plots represent 25 and 75 percentiles. ***P < 0.001; t test.
Fig. S2.
Fig. S2.
Distribution of mutation frequencies in B-cell subpopulations and biological replicates. (A) In both donors, the distributions in mutation frequency (mutations/100 bp) are highly similar in replicate analyses and distinct for each memory B-cell population analyzed. (B) The distribution of mutation frequencies (mutations/100 bp) in IgG subclasses.
Fig. 2.
Fig. 2.
IgG subclass use and mutation pattern of human PB memory B cells. (A) The IgG subclass composition of IgG+CD27+ and IgG+CD27 B-cell subsets revealed a significantly larger fraction of IgG3-switched B cells among the latter subpopulation (P < 0.001 by Fisher’s exact test). (B) IGHV gene mutation frequencies (mutations/100 bp) of IgG memory B-cell subclasses. Median values (black bars) are given as numbers; box plots represent 25 and 75 percentiles. *P < 0.05, ***P < 0.001; t test. (C) Ig-unmutated sequences were preferentially detectable among IgG+CD27 B cells, and among these, the IgG3+ fraction showed the highest frequency of unmutated sequences.
Fig. 3.
Fig. 3.
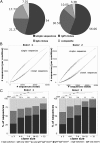
Clonal composition of human memory B cells. (A) The relative fraction of single and clonal B-cell sequences per donor is given. Clonal sequences are split up into sole IgM (IgM+IgD+CD27+ or IgM-only) clones, sole IgG clones and composite clones (IgM+IgD+CD27+ and/or IgM-only and IgG+ B-cell sequences). Numbers denote the fraction of sequences in each category. (B) To estimate the fraction of clones with increasing sample size, we determined clonality among randomly selected sequence samples per donor—sample sizes ranging from two to the maximum number of available sequences—by our CDRIII clustering approach. The regression curves (locally weighted scatter plot smoothing) revealed an unsaturated clonality of the memory B-cell pool in both donors. (C) Correlation of clone type fractions and clonal sizes. The larger a clone, the more likely it is of composite subtype (IgM+IgD+CD27+ and IgM-only/IgG+ B cells). This correlation is statistically highly significant (***P < 0.001; Fisher’s exact test, composite vs. noncomposite) already for clone sizes of more than three members. In contrast, clones consisting only of IgG+ B-cell sequences (with or without IgM-only B cells) are practically undetectable when sufficient numbers of B cells are analyzed. Bin sizes were chosen arbitrarily for clarity of the depiction, Fig. S3D shows a version of this figure lacking bins. In the legend, ∧ indicates “and,” and ∨ indicates “or.”
Fig. S3.
Fig. S3.
Clonal composition of human memory B cells. (A) Correlation of clone type fractions and clonal sizes as in Fig. 3B, except that clones composed of IgM+IgD+CD27+ and IgM-only sequences are included in the IgM clone fraction. ∧ indicates “and,” and ∨ indicates “or.” (B) IGHV gene use and (C) mutation frequencies (mutations/100 bp) of single or clonal sequences—no matter whether derived from composite or sole IgM (homogenous)—are very similar to each other. (D) Correlation of clone sizes and clone types as in Fig. 3C, nonstaggered depiction.
Fig. S4.
Fig. S4.
Explanation of shape parameters used to describe genealogic dendrograms.
Fig. 4.
Fig. 4.
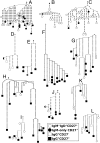
Genealogic analysis of human memory B-cell clones. (A–C) Sole IgM clones usually show an early and broad diversification, leading to bushy dendrograms. (D–F) Sole IgG clones tend to have long roots and narrow shapes. (G–L) typical examples of composite clone dendrograms, where IgM and IgG memory B-cell subsets are intermingled. Specific subsets are indicated by a gray scale code (legend), germ-line IGHV (root), and sequential mutation events are marked as small black circles. Less than 1% of nodes or leaves represent more than one sequence; occasional contributions from independent subsets are given as circles with split shading.
Fig. 5.
Fig. 5.
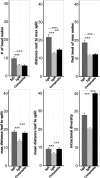
Statistical comparison of genealogical trees of memory B-cell clone subtypes. Tree parameters are defined in Table S4. Whereas sole IgM and sole IgG clones are statistically significant different in their dendrogram patterns, composite clones show combinations of these patterns. The higher intraclonal diversity of mixed clones compared with sole IgM or IgG clones likely reflects that the combination of mutation patterns of IgM and of IgG members results in high values for intraclonal diversity (**P < 0.01, ***P < 0.001; paired t test, error bars show SEM).
Fig. S5.
Fig. S5.
Genealogic analysis of human memory B-cell clones. (A–I) Selected dendrograms of IgM+IgD+CD27+, IgM-only, and IgG+CD27+ composite clones, where the B-cell subtypes are intermingled according to their IGHV gene mutation pattern. (J–Q) Selected dendrograms of B-cell clones including class switched B cells with more than one IgG subclass. Specific subsets are indicated by a gray scale code (legend); germ-line IGHV (root) and sequential mutation events are marked as small black circles. Less than 1% of nodes/leaves represent more than one sequence; occasional contributions from independent subsets or IgG subclasses are given as split-colored circles and additional colors, respectively.

Similar articles

Cited by

References

    1. Alt FW, Blackwell TK, Yancopoulos GD. Development of the primary antibody repertoire. Science. 1987;238(4830):1079–1087. - PubMed
    1. Goossens T, Klein U, Küppers R. Frequent occurrence of deletions and duplications during somatic hypermutation: Implications for oncogene translocations and heavy chain disease. Proc Natl Acad Sci USA. 1998;95(5):2463–2468. - PMC - PubMed
    1. Küppers R, Zhao M, Hansmann ML, Rajewsky K. Tracing B cell development in human germinal centres by molecular analysis of single cells picked from histological sections. EMBO J. 1993;12(13):4955–4967. - PMC - PubMed
    1. MacLennan IC. Germinal centers. Annu Rev Immunol. 1994;12:117–139. - PubMed
    1. Manis JP, Tian M, Alt FW. Mechanism and control of class-switch recombination. Trends Immunol. 2002;23(1):31–39. - PubMed

Publication types

Substances

Associated data