

Epigenetic silencing of tumor suppressor genes during in vitro Epstein-Barr virus infection
- PMID: 26324942
- PMCID: PMC4577197
- DOI: 10.1073/pnas.1503806112
Epigenetic silencing of tumor suppressor genes during in vitro Epstein-Barr virus infection
Abstract
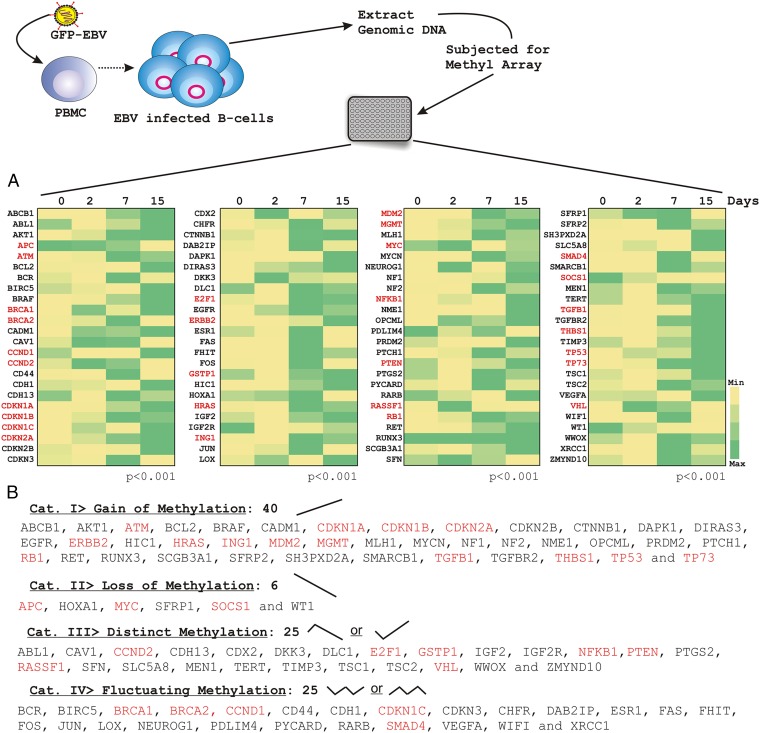
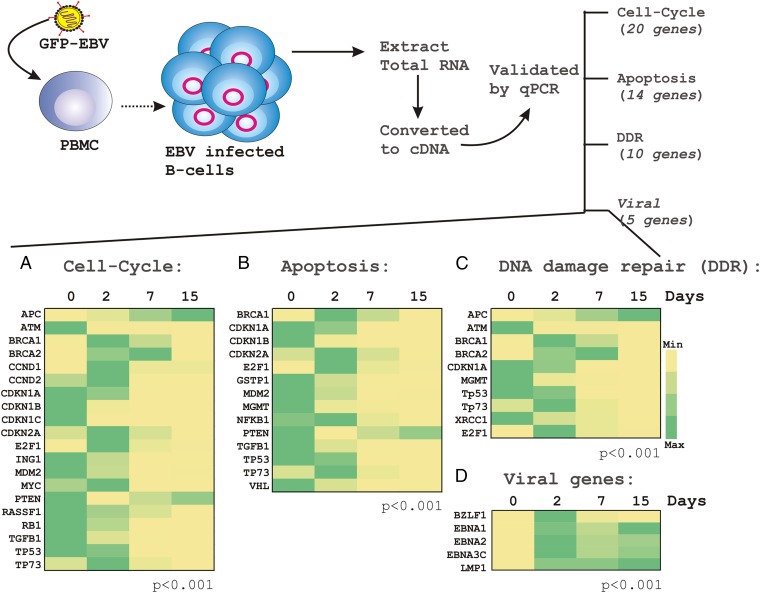
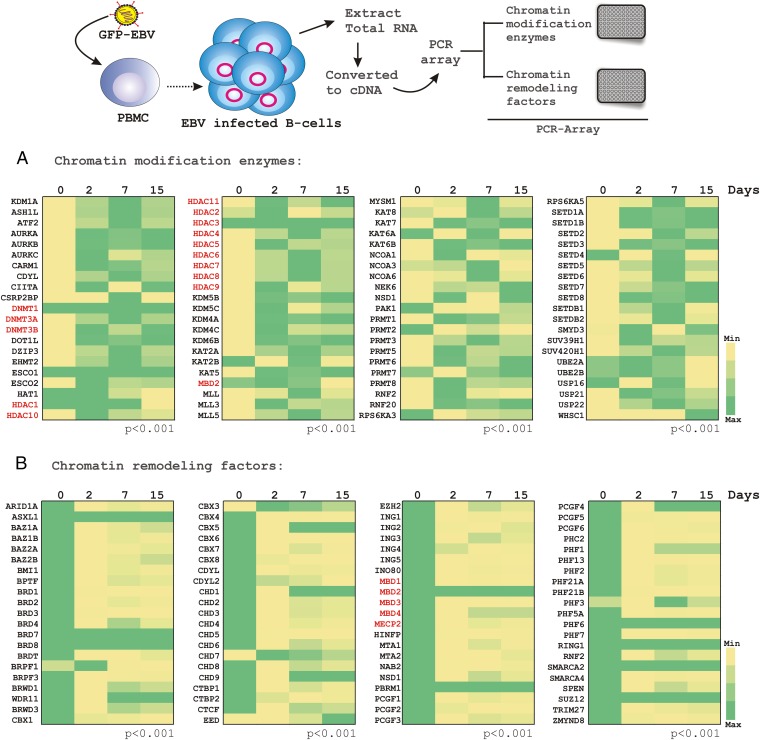
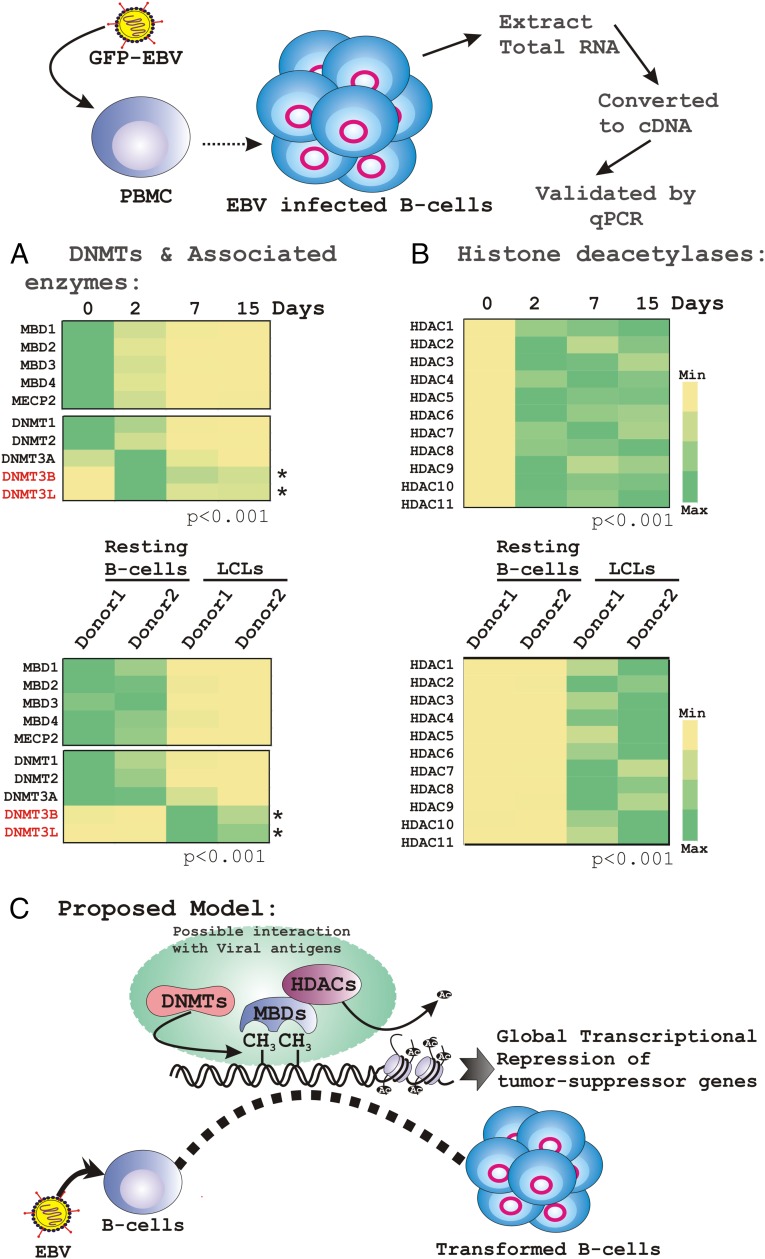
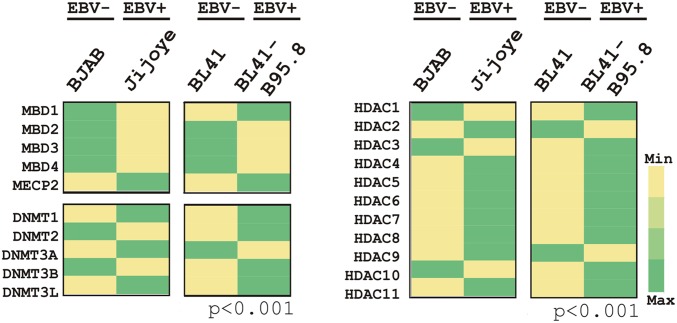
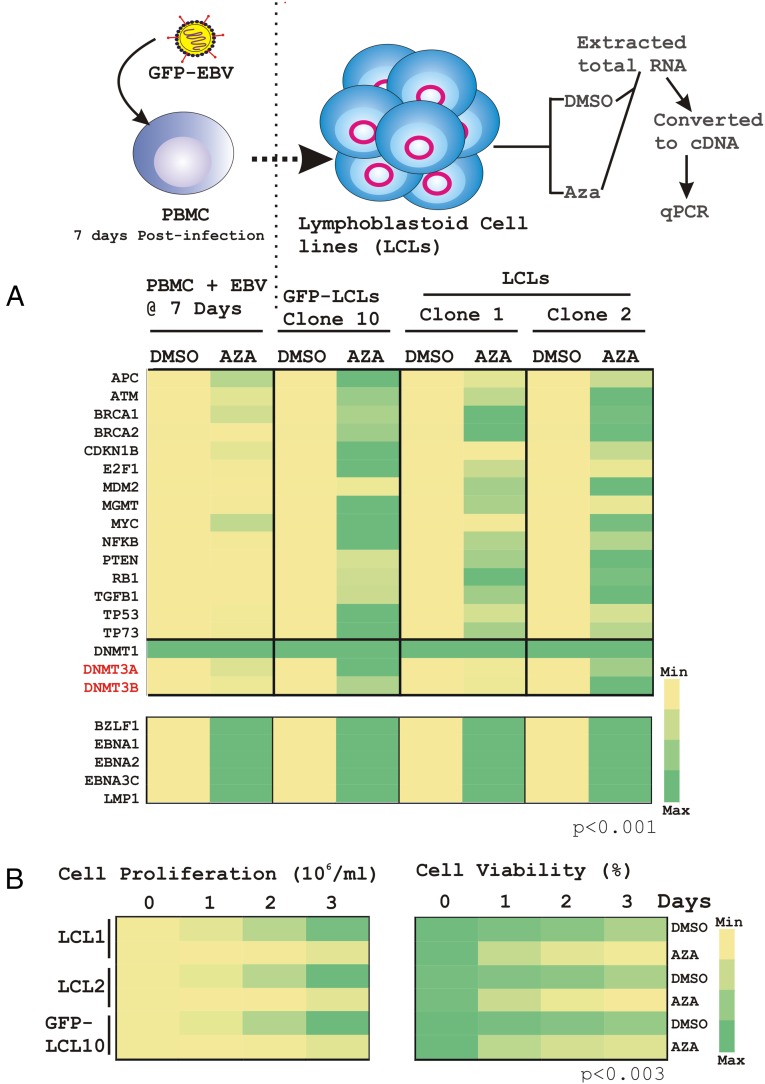
DNA-methylation at CpG islands is one of the prevalent epigenetic alterations regulating gene-expression patterns in mammalian cells. Hypo- or hypermethylation-mediated oncogene activation, or tumor suppressor gene (TSG) silencing mechanisms, widely contribute to the development of multiple human cancers. Furthermore, oncogenic viruses, including Epstein-Barr virus (EBV)-associated human cancers, were also shown to be influenced by epigenetic modifications on the viral and cellular genomes in the infected cells. We investigated EBV infection of resting B lymphocytes, which leads to continuously proliferating lymphoblastoid cell lines through examination of the expression pattern of a comprehensive panel of TSGs and the epigenetic modifications, particularly methylation of their regulatory sequences. EBV infection of primary B lymphocytes resulted in global transcriptional repression of TSGs through engagement of hypermethylation. Therefore, CpG methylation profiles of TSGs may be used as a prognostic marker as well as development of potential therapeutic strategies for controlling acute infection and EBV-associated B-cell lymphomas.
Keywords: B-cell lymphoma; EBV; lymphoblastoid cell lines; promoter methylation; tumor suppressor genes.
Conflict of interest statement
The authors declare no conflict of interest.
Figures
Similar articles
-
Epstein-barr virus latency in B cells leads to epigenetic repression and CpG methylation of the tumour suppressor gene Bim.PLoS Pathog. 2009 Jun;5(6):e1000492. doi: 10.1371/journal.ppat.1000492. Epub 2009 Jun 26. PLoS Pathog. 2009. PMID: 19557159 Free PMC article.
-
BZLF1 governs CpG-methylated chromatin of Epstein-Barr Virus reversing epigenetic repression.PLoS Pathog. 2012 Sep;8(9):e1002902. doi: 10.1371/journal.ppat.1002902. Epub 2012 Sep 6. PLoS Pathog. 2012. PMID: 22969425 Free PMC article.
-
Interplay between the Epigenetic Enzyme Lysine (K)-Specific Demethylase 2B and Epstein-Barr Virus Infection.J Virol. 2019 Jun 14;93(13):e00273-19. doi: 10.1128/JVI.00273-19. Print 2019 Jul 1. J Virol. 2019. PMID: 30996097 Free PMC article.
-
Epigenetic dysregulation of the host cell genome in Epstein-Barr virus-associated neoplasia.Semin Cancer Biol. 2009 Jun;19(3):158-64. doi: 10.1016/j.semcancer.2009.02.012. Epub 2009 Feb 24. Semin Cancer Biol. 2009. PMID: 19429479 Review.
-
Regulation and dysregulation of Epstein-Barr virus latency: implications for the development of autoimmune diseases.Autoimmunity. 2008 May;41(4):298-328. doi: 10.1080/08916930802024772. Autoimmunity. 2008. PMID: 18432410 Review.
Cited by
-
Time-resolved transcriptomes reveal diverse B cell fate trajectories in the early response to Epstein-Barr virus infection.Cell Rep. 2022 Aug 30;40(9):111286. doi: 10.1016/j.celrep.2022.111286. Cell Rep. 2022. PMID: 36044865 Free PMC article.
-
Upregulation of GLS1 Isoforms KGA and GAC Facilitates Mitochondrial Metabolism and Cell Proliferation in Epstein-Barr Virus Infected Cells.Viruses. 2020 Jul 27;12(8):811. doi: 10.3390/v12080811. Viruses. 2020. PMID: 32727118 Free PMC article.
-
Epigenetic Regulation of Tumor Suppressors by Helicobacter pylori Enhances EBV-Induced Proliferation of Gastric Epithelial Cells.mBio. 2018 Apr 24;9(2):e00649-18. doi: 10.1128/mBio.00649-18. mBio. 2018. PMID: 29691341 Free PMC article.
-
MicroRNA-330-3p promotes cell invasion and metastasis in non-small cell lung cancer through GRIA3 by activating MAPK/ERK signaling pathway.J Hematol Oncol. 2017 Jun 19;10(1):125. doi: 10.1186/s13045-017-0493-0. J Hematol Oncol. 2017. Retraction in: J Hematol Oncol. 2020 Oct 22;13(1):142. doi: 10.1186/s13045-020-00969-0. PMID: 28629431 Free PMC article. Retracted.
-
Pathogenesis: Infections causing gastric cancer.Nat Microbiol. 2016 Mar 29;1:16038. doi: 10.1038/nmicrobiol.2016.38. Nat Microbiol. 2016. PMID: 27572450 No abstract available.
References
Publication types
MeSH terms
Substances
Grants and funding
- P01 CA174439/CA/NCI NIH HHS/United States
- P30 DK050306/DK/NIDDK NIH HHS/United States
- CA174439/CA/NCI NIH HHS/United States
- P30 CA016520/CA/NCI NIH HHS/United States
- WT_/Wellcome Trust/United Kingdom
- R01 CA137894/CA/NCI NIH HHS/United States
- P01-CA-174439/CA/NCI NIH HHS/United States
- R01 CA171979/CA/NCI NIH HHS/United States
- CA137894/CA/NCI NIH HHS/United States
- R01 CA177423/CA/NCI NIH HHS/United States
- CA171979/CA/NCI NIH HHS/United States
- P30-DK-050306/DK/NIDDK NIH HHS/United States
- CA177423/CA/NCI NIH HHS/United States
LinkOut - more resources
Full Text Sources
Other Literature Sources
Miscellaneous
