. 2015 Sep 1;10(9):e0137171.
doi: 10.1371/journal.pone.0137171. eCollection 2015.

Discovery of a Novel Immune Gene Signature with Profound Prognostic Value in Colorectal Cancer: A Model of Cooperativity Disorientation Created in the Process from Development to Cancer

Affiliations

Discovery of a Novel Immune Gene Signature with Profound Prognostic Value in Colorectal Cancer: A Model of Cooperativity Disorientation Created in the Process from Development to Cancer

Ning An et al. PLoS One. .

Abstract

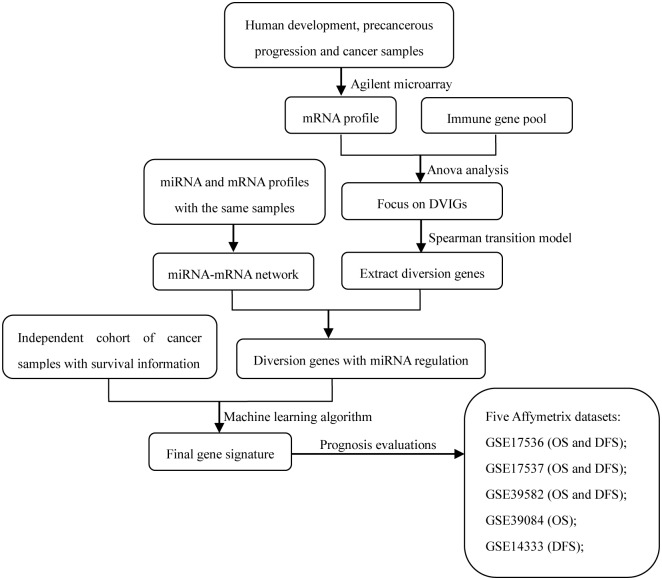
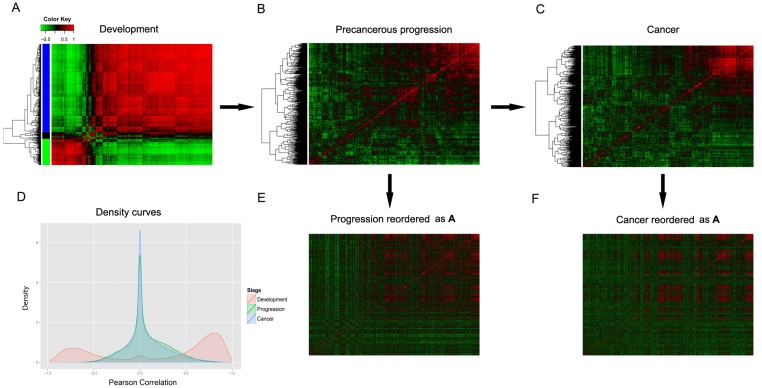
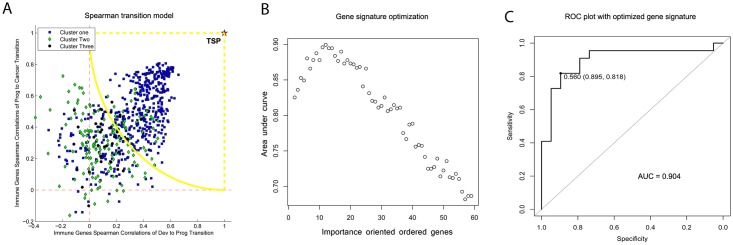
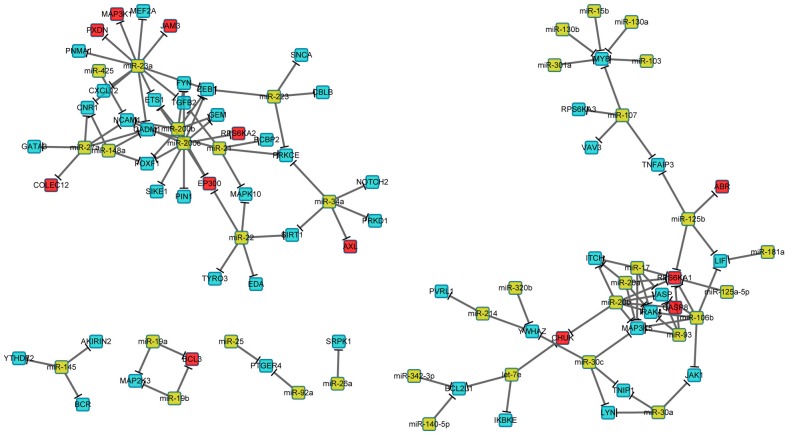
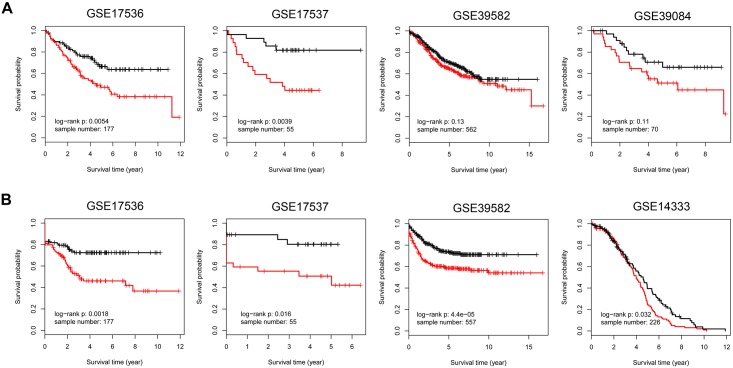
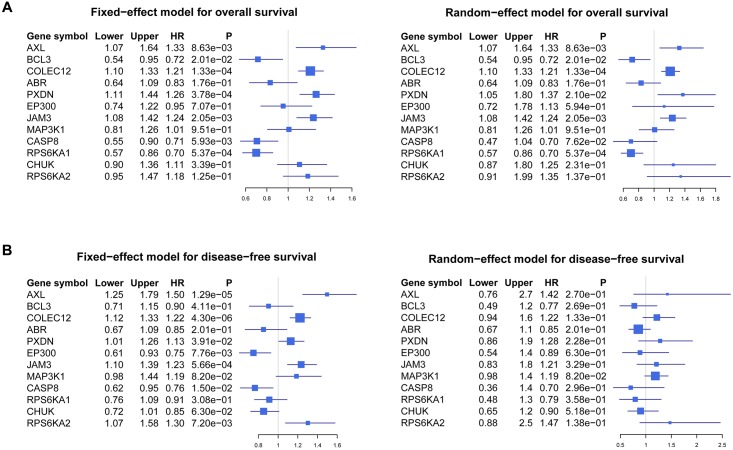
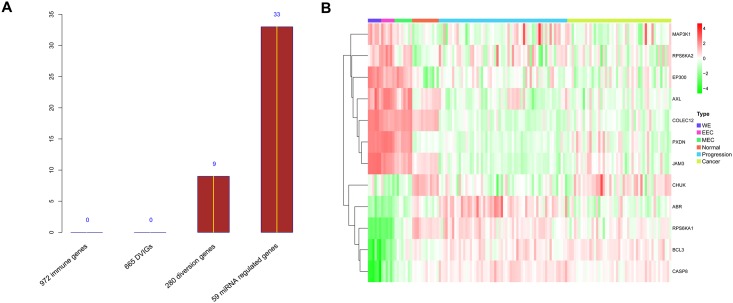
Immune response-related genes play a major role in colorectal carcinogenesis by mediating inflammation or immune-surveillance evasion. Although remarkable progress has been made to investigate the underlying mechanism, the understanding of the complicated carcinogenesis process was enormously hindered by large-scale tumor heterogeneity. Development and carcinogenesis share striking similarities in their cellular behavior and underlying molecular mechanisms. The association between embryonic development and carcinogenesis makes embryonic development a viable reference model for studying cancer thereby circumventing the potentially misleading complexity of tumor heterogeneity. Here we proposed that the immune genes, responsible for intra-immune cooperativity disorientation (defined in this study as disruption of developmental expression correlation patterns during carcinogenesis), probably contain untapped prognostic resource of colorectal cancer. In this study, we determined the mRNA expression profile of 137 human biopsy samples, including samples from different stages of human colonic development, colorectal precancerous progression and colorectal cancer samples, among which 60 were also used to generate miRNA expression profile. We originally established Spearman correlation transition model to quantify the cooperativity disorientation associated with the transition from normal to precancerous to cancer tissue, in conjunction with miRNA-mRNA regulatory network and machine learning algorithm to identify genes with prognostic value. Finally, a 12-gene signature was extracted, whose prognostic value was evaluated using Kaplan-Meier survival analysis in five independent datasets. Using the log-rank test, the 12-gene signature was closely related to overall survival in four datasets (GSE17536, n = 177, p = 0.0054; GSE17537, n = 55, p = 0.0039; GSE39582, n = 562, p = 0.13; GSE39084, n = 70, p = 0.11), and significantly associated with disease-free survival in four datasets (GSE17536, n = 177, p = 0.0018; GSE17537, n = 55, p = 0.016; GSE39582, n = 557, p = 4.4e-05; GSE14333, n = 226, p = 0.032). Cox regression analysis confirmed that the 12-gene signature was an independent factor in predicting colorectal cancer patient's overall survival (hazard ratio: 1.759; 95% confidence interval: 1.126-2.746; p = 0.013], as well as disease-free survival (hazard ratio: 2.116; 95% confidence interval: 1.324-3.380; p = 0.002).


Conflict of interest statement

Competing Interests: The authors have declared that no competing interests exist.

Figures

Fig 1
Fig 1. Schematic of the stepwise gene signature selection and evaluation workflow.
CRC colorectal cancer, DVIG development varying immune gene, OS overall survival, DFS disease-free survival.
Fig 2
Fig 2. Pearson correlation heatmaps and density curve plot of 665 DVIGs.
Heatmaps of adjusted Pearson correlations for 665 DVIGs in (A) development, (B) precancerous progression and (C) cancer, respectively. Genes were clustered into three clusters (highlighted with different colors) by UCA. (D) Density plot of pairwise adjusted Pearson correlations for all three stages. The curve for the development stage is bimodal distribution, but unimodal for in progression and cancer stages. In order to render intra-immune vectors comparable, genes were reordered in the progression and cancer stage heatmaps to match the order in the development stage heatmap, to generate (E) reordered progression heatmap and (F) reordered cancer heatmap. DVIG, development varying immune gene; UCA, unsupervised clustering algorithm.
Fig 3
Fig 3. Gene signature optimization based on Spearman correlation transition model and AUC-RF algorithm.
(A) The 665 DVIGs were projected onto a Spearman correlation transition coordinate system based on their cooperativity disorientation between the consecutive stages. Genes were colored in the same way as in the development heatmap. (B) The AUC-RF algorithm was used for gene signature optimization. Genes were recursively removed from an importance-ordered gene list until the largest AUC value was met. (C) The biggest AUC of 0.904 (95% CI: 0.799~1.000) was obtained when the number of genes were reduced to 12, with 81.8% sensitivity (95% CI: 0.636–0.955) and 89.5% specificity (95% CI: 0.737–1.000). Dev, development; Prog, progression; TPS, theoretically stable point; AUC, area under curve; DVIG, development varying immune gene; CI, confidence interval.
Fig 4
Fig 4. miRNA-mRNA regulatory network.
Dark yellow nodes represent miRNAs. Red and sapphire nodes represent mRNAs, among which red ones are genes in the 12-gene signature. Directed solid edges represent miRNA-mRNA regulation.
Fig 5
Fig 5. Kaplan–Meier survival analyses and log-rank tests of the 12-gene signature.
Kaplan–Meier survival analyses and log-rank tests were conducted to evaluate the prognostic value of the 12-gene signature. (A) The performance of the 12-gene signature in OS discrimination. Datasets with OS information were GSE17536, GSE17537, GSE39582 and GSE39084. (B) The performance of the 12-gene signature in DFS discrimination. Datasets with DFS information were GSE17536, GSE17537, GSE39582 and GSE14333. OS, overall survival; DFS, disease-free survival.
Fig 6
Fig 6. Forest plot of the association between individual genes in the 12-gene signature and CRC survival.
(A) Forest plot of the association between individual genes and OS with a fixed-effect model in datasets containing OS information (GSE17536, GSE17537, GSE39582 and GSE39084). Meta-analysis of these 12 genes in four independent datasets was conducted, and HR, 95% CI of each gene and corresponding p value were calculated and plotted in the forest plot. (B) Forest plot of the association between individual genes and DFS with a random-effect model in four datasets containing DFS information (GSE17536, GSE17537, GSE39582 and GSE14333). CRC, colorectal cancer; HR, hazard ratio; CI; confidence interval; OS, overall survival; DFS, disease-free survival.
Fig 7
Fig 7. Random gene sampling verified the validity of our step- gene selection procedure.
(A) Bar plot of the number of times that 12 randomly chosen genes could simultaneously discriminate four survival datasets (OS and DFS in GES17536 and GSE17537, DFS in GSE39582 and GSE14333). (B) Heatmap of 137 biopsy samples established with mRNA expression profile of the 12-gene signature. The mRNA raw data were normalized and then filtered (see “Materials and Methods”). Rows represent genes, and columns represent biopsy samples. Rows, rather than columns, were reordered using UCA, whereas samples of the same type were placed together. DVIG, development varying immune gene; UCA, unsupervised clustering algorithm; OS, overall survival; DFS, disease-free survival.

References

    1. Ferlay J, Soerjomataram I, Dikshit R, Eser S, Mathers C, Rebelo M, et al. Cancer incidence and mortality worldwide: sources, methods and major patterns in GLOBOCAN 2012. Int J Cancer. 2015;136(5):E359–86. Epub 2014/09/16. 10.1002/ijc.29210 . - DOI - PubMed
    1. Brenner H, Kloor M, Pox CP. Colorectal cancer. Lancet. 2014;383(9927):1490–502. Epub 2013/11/15. 10.1016/S0140-6736(13)61649-9 . - DOI - PubMed
    1. Kanthan R, Senger JL, Kanthan SC. Molecular events in primary and metastatic colorectal carcinoma: a review. Patholog Res Int. 2012;2012:597497 Epub 2012/09/22. 10.1155/2012/597497 - DOI - PMC - PubMed
    1. Troiani T, Martinelli E, Napolitano S, Morgillo F, Belli G, Cioffi L, et al. Molecular aspects of resistance to biological and non-biological drugs and strategies to overcome resistance in colorectal cancer. Curr Med Chem. 2014;21(14):1639–53. Epub 2013/09/03. . - PubMed
    1. Schlicker A, Beran G, Chresta CM, McWalter G, Pritchard A, Weston S, et al. Subtypes of primary colorectal tumors correlate with response to targeted treatment in colorectal cell lines. BMC Med Genomics. 2012;5:66 Epub 2013/01/01. 10.1186/1755-8794-5-66 - DOI - PMC - PubMed

Publication types

Associated data