. 2015 Nov;7(11):1423-31.
doi: 10.1039/c5ib00146c.

Microfluidic mazes to characterize T-cell exploration patterns following activation in vitro

Affiliations

Microfluidic mazes to characterize T-cell exploration patterns following activation in vitro

Namrata G Jain et al. Integr Biol (Camb). 2015 Nov.

Abstract

The migration of T-cell subsets within peripheral tissues is characteristic of inflammation and immunoregulation. In general, the lymphocyte migratory response is assumed directional and guided by local gradients of chemoattractants and/or chemorepellents. However, little is known about how cells explore their tissue environment, and whether lymphocyte activation may influence speed and exploratory patterns of migration. To probe migration patterns by T-cells we designed a microfluidic maze device that replicates critical features of a tissue-like microenvironment. We quantified the migration patterns of unstimulated and mitogen-activated human T-cells at single cell resolution and found significant differences in exploration within microfluidic mazes. While unstimulated lymphocytes migrated in a directed manner, activated T-cells migrated through large areas of the mazes in an exploratory pattern in response to the chemoattractants RANTES (CCL5) and IP-10 (CXCL10). The analysis of migration enabled by the microfluidic devices help develop new methods for determining how human circulating T-cells function in vivo to seek out antigens in health and disease states.


Figures
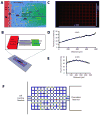
Figure 1
Figure 1. Lymphocyte migration in tissues and devices to quantify lymphocyte migration in vitro
(A) T-cells often migrate through the parenchyma, confined by the extracellular spaces, toward areas of inflammation in tissues. Hypothetical trajectories of migration are represented by yellow lines. (B) A microfluidic device simulates the extracellular space in tissues as an orthogonal maze of channels with 50 μm pitch. A reservoir of chemoattractant and a cell loading chamber serve as source and sink, respectively, to create a chemical gradient across the maze. Several mazes were employed simultaneously in one device. (C) Enhanced microscopy image of the maze in the presence of a TRITC-Dextran gradient through the maze, at one hour after gradient formation between a reservoir to the right and the cell loading chamber to the left. Fluorescent activity of the TRITC dextran gradient is shown along the x (D) and y (E) plane of the maze. (F) To quantify the migration of lymphocytes through the maze, we manually tracked the cells locations. From these, cell tracks were automatically generated (i.e. dashed and dotted lines). We assigned different colours to different nodes in the maze depending on the number of cells passing through each node. Yellow colour denotes nodes that were traversed only once; red colour denotes heavily trafficked nodes, with multiple cells passing through; black colour denotes nodes in which cell migration was arrested.
Figure 2
Figure 2. T-cell migration patterns inside the mazes in the presence of chemoattractant CXCL10/IP-10
(A) Heat map compilation of the locations of unstimulated T-cells inside the maze in the presence of a gradient of chemoattractant IP-10. Colors range from blue (unvisited nodes of the maze, relative value 0) to red (most traversed nodes for all conditions, relative value 1 – see legend to the right). (B) Mitogen-activated T-cells in an CXCL10/IP-10 gradient move robustly through the mazes and the majority of nodes are visited repeatedly. (C) Unstimulated T-cells rarely enter the maze in uniform CXCL10/IP-10. (D) Mitogen-activated T-cells enter the mazes but most frequently traverse the nodes close to the entrance when a uniform CXCL10/IP-10 gradient is present. Locations in the mazes are represented in microns (X,Y coordinates on the side of the maze drawing), with the entrance to the maze at (0,0) and the chemoattractant reservoir at (0,800).
Figure 3
Figure 3. T-cell migration patterns inside the mazes in the presence of chemoattractant CCL5/RANTES
(A) Unstimulated T-cells show robust migration through the maze in the presence of gradients of chemoattractant CCL5/RANTES. (B) Mitogen activated T-cells also migrate robustly in gradient CCL5/RANTES. (C) Unstimulated T-cells are dispersed through the maze in uniform concentrations of CCL5/RANTES. (D) Mitogen activated T-cells traverse most of the nodes of the maze in uniform concentrations of CCL5/RANTES. Colors code the relative number of cell visits for each node and range from blue (unvisited nodes of the maze, relative value 0) to red (most traversed nodes for all conditions, relative value 1 – see legend to the right). Locations in the maze are represented in microns (X,Y coordinates on the side of the maze drawing), with the entrance to the maze at (0,0) and the chemoattractant reservoir at (0,800).
Figure 4
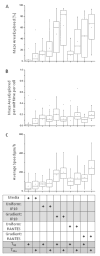
Figure 4. Quantification of T-cells migrating through the mazes in the presence of chemoattractants
(A) The area of the maze explored by the moving T-cells increases with cell stimulation and the presence of guiding gradients of chemoattractant. Mitogen activated T-cells in CXCL10/IP-10 gradients exhibited the most exploratory behavior in comparison to unstimulated T-cells in CXCL10/IP-10 gradient. We measured no significant difference with respect to area of coverage between unstimulated and mitogen-activated T-cells in CCL5/RANTES. (B) The area of the maze explored, normalized by the number of cells and time, reveals that T-cells are most exploratory in the presence of CXCL10/IP-10 gradients. (C) The migration speed of the T-cells was the highest in mitogen-activated T-cells in gradients of CCL5/RANTES.

Similar articles

Cited by

References

    1. Mueller SN. Immunol Cell Biol. 2013;91:290–296. - PubMed
    1. Robson AW. British medical journal. 1906;1:601–605. - PMC - PubMed
    1. Woodland DL, Dutton RW. Curr Opin Immunol. 2003;15:336–342. - PubMed
    1. Cyster JG. Annu Rev Immunol. 2005;23:127–159. - PubMed
    1. Bonecchi R, Bianchi G, Bordignon PP, D’Ambrosio D, Lang R, Borsatti A, Sozzani S, Allavena P, Gray PA, Mantovani A, Sinigaglia F. J Exp Med. 1998;187:129–134. - PMC - PubMed

Publication types

LinkOut - more resources