

Differential Ratios of Omega Fatty Acids (AA/EPA+DHA) Modulate Growth, Lipid Peroxidation and Expression of Tumor Regulatory MARBPs in Breast Cancer Cell Lines MCF7 and MDA-MB-231
- PMID: 26325577
- PMCID: PMC4556657
- DOI: 10.1371/journal.pone.0136542
Differential Ratios of Omega Fatty Acids (AA/EPA+DHA) Modulate Growth, Lipid Peroxidation and Expression of Tumor Regulatory MARBPs in Breast Cancer Cell Lines MCF7 and MDA-MB-231
Abstract
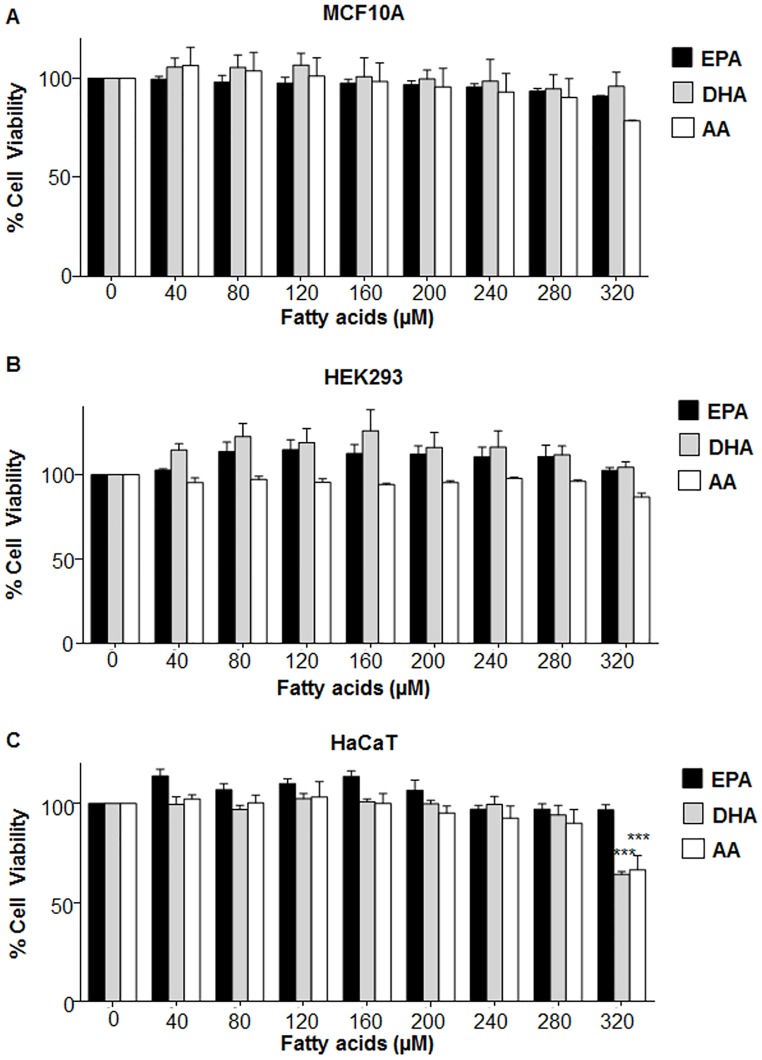
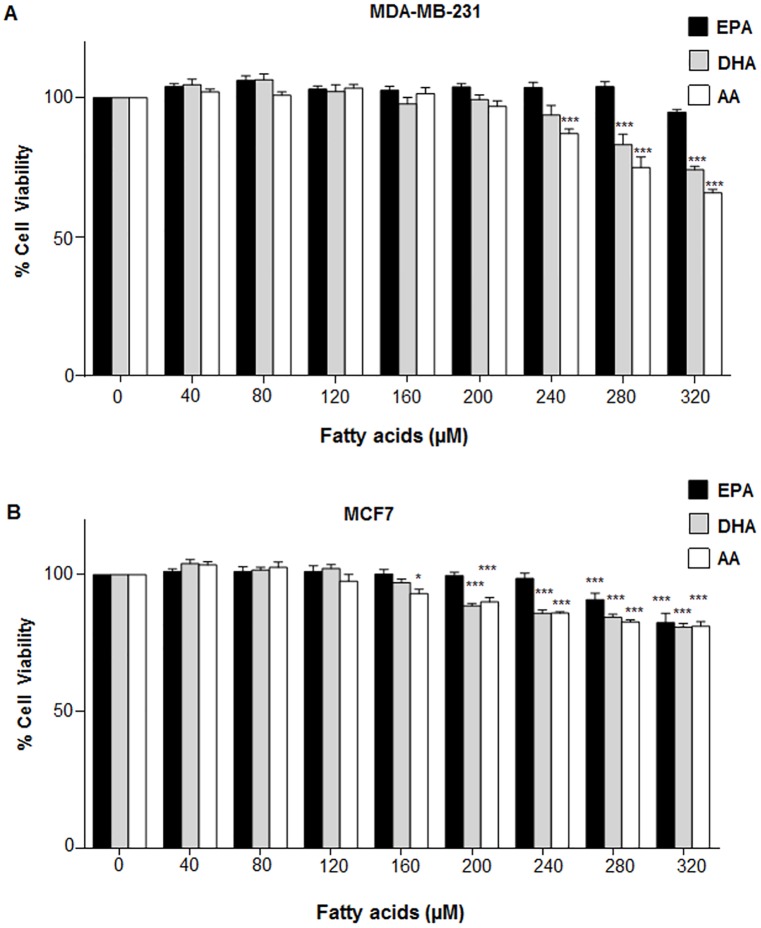
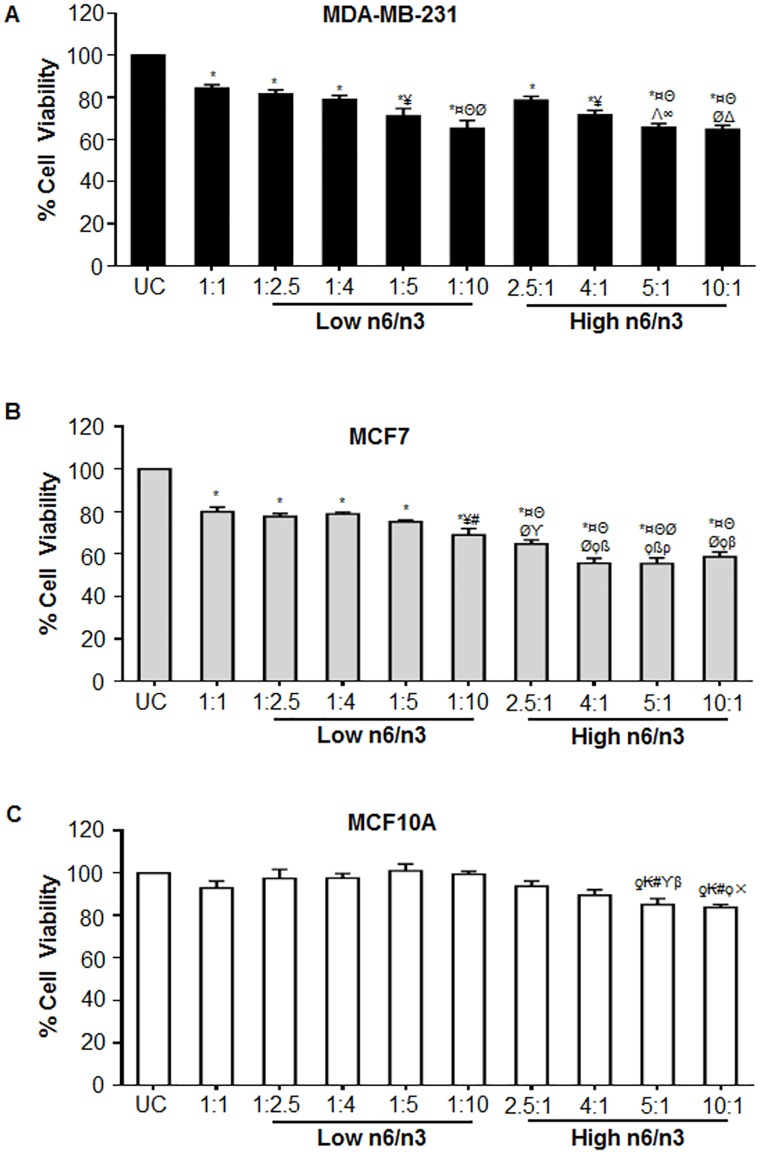
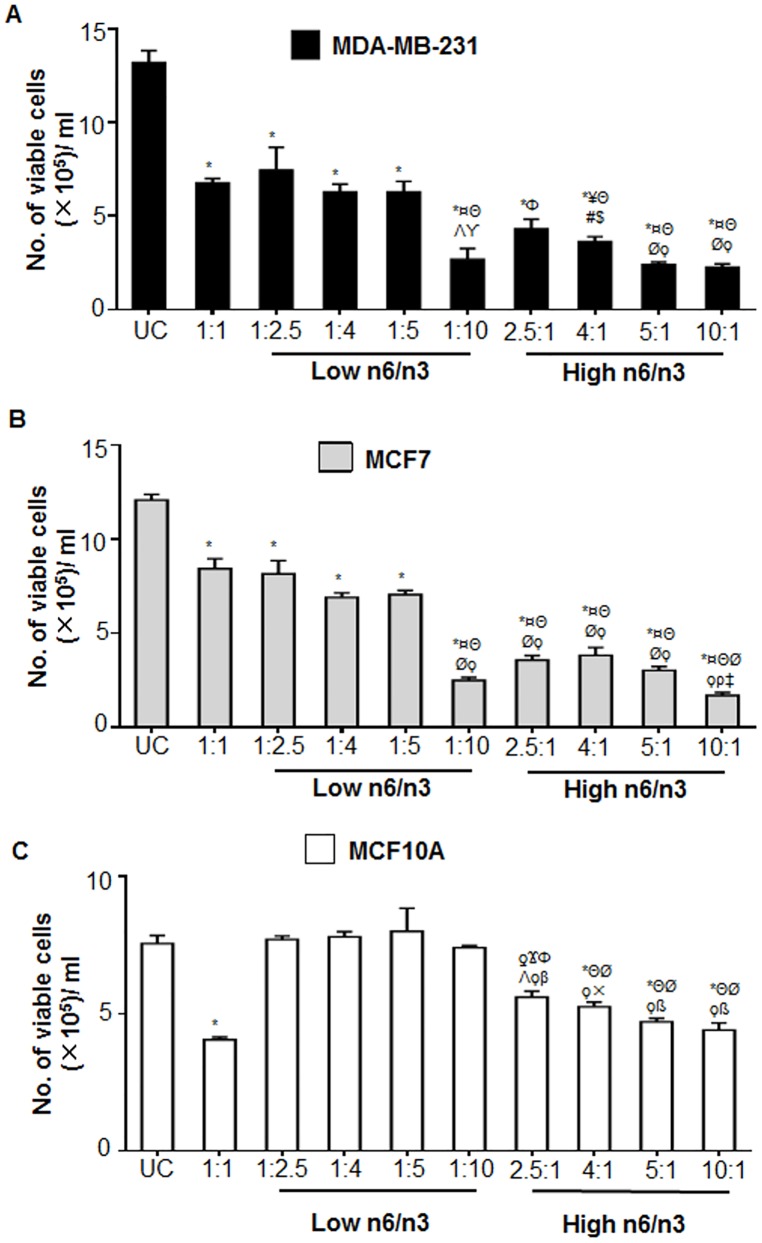
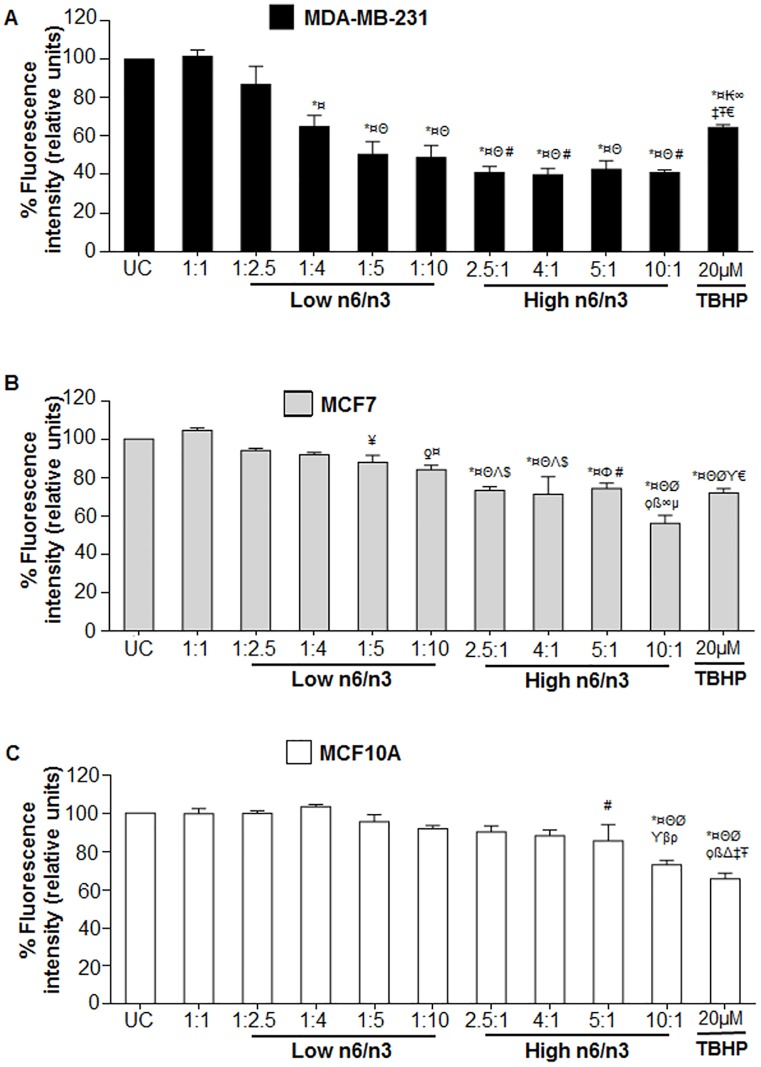
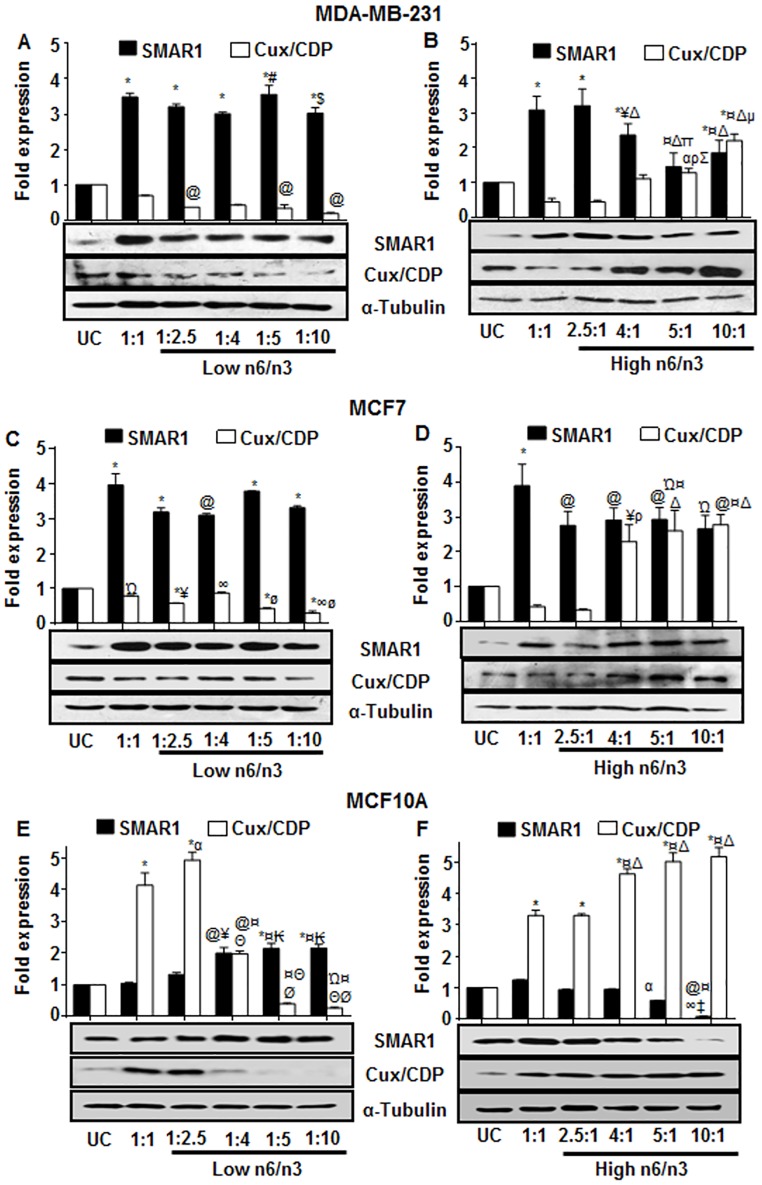
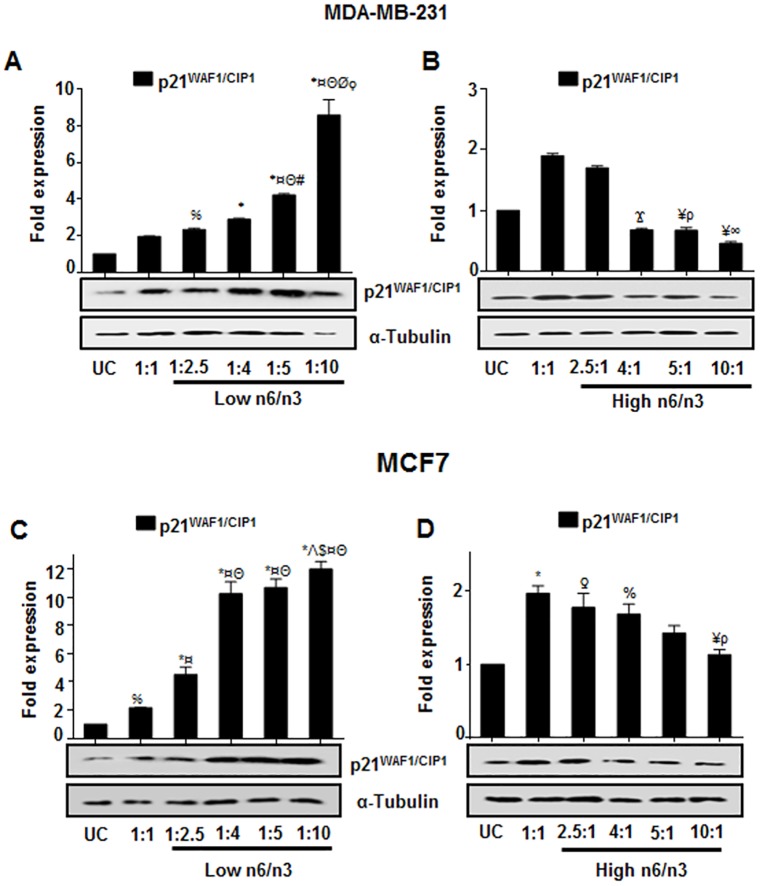
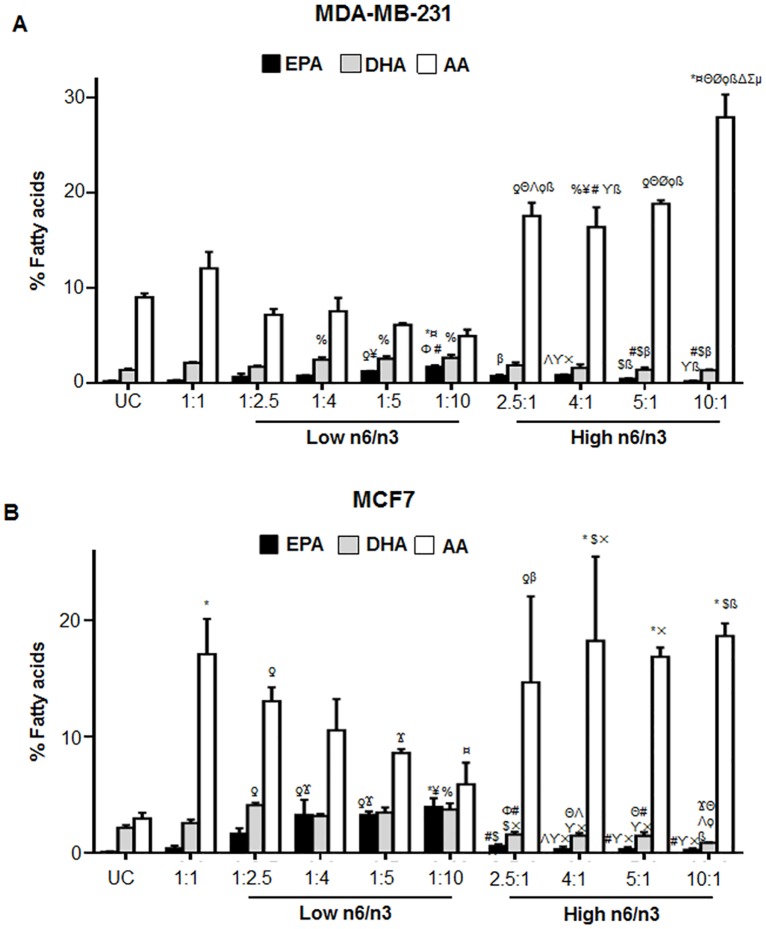
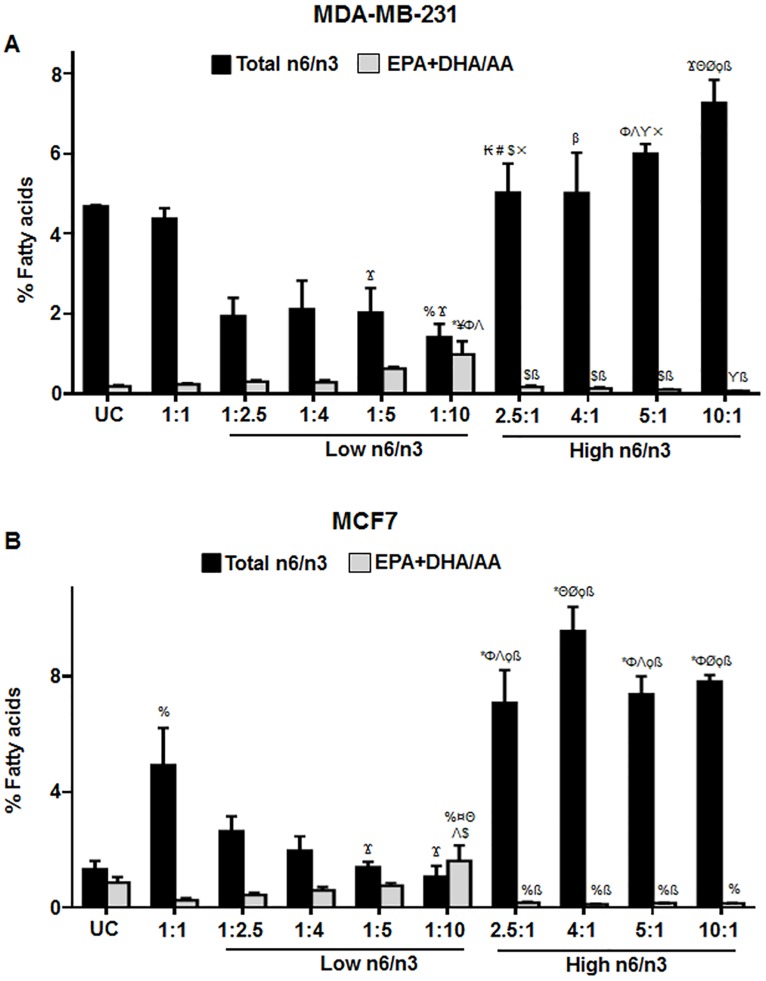
Omega 3 (n3) and Omega 6 (n6) polyunsaturated fatty acids (PUFAs) have been reported to exhibit opposing roles in cancer progression. Our objective was to determine whether different ratios of n6/n3 (AA/EPA+DHA) FAs could modulate the cell viability, lipid peroxidation, total cellular fatty acid composition and expression of tumor regulatory Matrix Attachment Region binding proteins (MARBPs) in breast cancer cell lines and in non-cancerous, MCF10A cells. Low ratios of n6/n3 (1:2.5, 1:4, 1:5, 1:10) FA decreased the viability and growth of MDA-MB-231 and MCF7 significantly compared to the non-cancerous cells (MCF10A). Contrarily, higher n6/n3 FA (2.5:1, 4:1, 5:1, 10:1) decreased the survival of both the cancerous and non-cancerous cell types. Lower ratios of n6/n3 selectively induced LPO in the breast cancer cells whereas the higher ratios induced in both cancerous and non-cancerous cell types. Interestingly, compared to higher n6/n3 FA ratios, lower ratios increased the expression of tumor suppressor MARBP, SMAR1 and decreased the expression of tumor activator Cux/CDP in both breast cancer and non-cancerous, MCF10A cells. Low n6/n3 FAs significantly increased SMAR1 expression which resulted into activation of p21WAF1/CIP1 in MDA-MB-231 and MCF7, the increase being ratio dependent in MDA-MB-231. These results suggest that increased intake of n3 fatty acids in our diet could help both in the prevention as well as management of breast cancer.
Conflict of interest statement
Figures
Similar articles
-
Novel signaling molecules implicated in tumor-associated fatty acid synthase-dependent breast cancer cell proliferation and survival: Role of exogenous dietary fatty acids, p53-p21WAF1/CIP1, ERK1/2 MAPK, p27KIP1, BRCA1, and NF-kappaB.Int J Oncol. 2004 Mar;24(3):591-608. Int J Oncol. 2004. PMID: 14767544
-
Protective role of n6/n3 PUFA supplementation with varying DHA/EPA ratios against atherosclerosis in mice.J Nutr Biochem. 2016 Jun;32:171-80. doi: 10.1016/j.jnutbio.2016.02.010. Epub 2016 Mar 21. J Nutr Biochem. 2016. PMID: 27142749
-
Overexpression and hyperactivity of breast cancer-associated fatty acid synthase (oncogenic antigen-519) is insensitive to normal arachidonic fatty acid-induced suppression in lipogenic tissues but it is selectively inhibited by tumoricidal alpha-linolenic and gamma-linolenic fatty acids: a novel mechanism by which dietary fat can alter mammary tumorigenesis.Int J Oncol. 2004 Jun;24(6):1369-83. Int J Oncol. 2004. PMID: 15138577
-
[Molecular mechanisms of action and health benefits of polyunsaturated fatty acids].Rev Invest Clin. 2005 May-Jun;57(3):457-72. Rev Invest Clin. 2005. PMID: 16187707 Review. Spanish.
-
Dietary omega-3 fatty acids for women.Biomed Pharmacother. 2007 Feb-Apr;61(2-3):105-12. doi: 10.1016/j.biopha.2006.09.015. Epub 2007 Jan 2. Biomed Pharmacother. 2007. PMID: 17254747 Review.
Cited by
-
Treatment with flaxseed oil induces apoptosis in cultured malignant cells.Heliyon. 2019 Aug 9;5(8):e02251. doi: 10.1016/j.heliyon.2019.e02251. eCollection 2019 Aug. Heliyon. 2019. PMID: 31440598 Free PMC article.
-
Relationships between erythrocyte membrane mono- and poly- unsaturated fatty acid composition and clinical/cognitive indices in antipsychotic-free schizophrenia patients.Front Psychiatry. 2024 Apr 23;15:1361997. doi: 10.3389/fpsyt.2024.1361997. eCollection 2024. Front Psychiatry. 2024. PMID: 38716119 Free PMC article.
-
Alpha-linolenic acid regulates Cox2/VEGF/MAP kinase pathway and decreases the expression of HPV oncoproteins E6/E7 through restoration of p53 and Rb expression in human cervical cancer cell lines.Tumour Biol. 2016 Mar;37(3):3295-305. doi: 10.1007/s13277-015-4170-z. Epub 2015 Oct 6. Tumour Biol. 2016. PMID: 26440049
-
Wild or Reared? Cassiopea andromeda Jellyfish as a Potential Biofactory.Mar Drugs. 2025 Jan 1;23(1):19. doi: 10.3390/md23010019. Mar Drugs. 2025. PMID: 39852521 Free PMC article.
-
Harnessing Potential of ω-3 Polyunsaturated Fatty Acid with Nanotechnology for Enhanced Breast Cancer Therapy: A Comprehensive Investigation into ALA-Based Liposomal PTX Delivery.Pharmaceutics. 2024 Jul 9;16(7):913. doi: 10.3390/pharmaceutics16070913. Pharmaceutics. 2024. PMID: 39065610 Free PMC article.
References
-
- Jemal A, Center MM, DeSantis C, Ward EM. Global patterns of cancer incidence and mortality rates and trends. Cancer epidemiology, biomarkers & prevention: a publication of the American Association for Cancer Research, cosponsored by the American Society of Preventive Oncology. 2010;19(8):1893–907. - PubMed
-
- Aggarwal BB, Ichikawa H, Garodia P, Weerasinghe P, Sethi G, Bhatt ID, et al. From traditional Ayurvedic medicine to modern medicine: identification of therapeutic targets for suppression of inflammation and cancer. Expert opinion on therapeutic targets. 2006;10(1):87–118. - PubMed
-
- German JB, Roberts MA, Watkins SM. Genomics and metabolomics as markers for the interaction of diet and health: lessons from lipids. The Journal of nutrition. 2003;133(6 Suppl 1):2078s–83s. - PubMed
-
- Skerrett PJ, Hennekens CH. Consumption of fish and fish oils and decreased risk of stroke. Preventive cardiology. 2003;6(1):38–41. - PubMed
Publication types
MeSH terms
Substances
LinkOut - more resources
Full Text Sources
Other Literature Sources
Medical
Research Materials
Miscellaneous
