. 2015 Sep 1;10(9):e0137024.
doi: 10.1371/journal.pone.0137024. eCollection 2015.

Modelling the Geographical Origin of Rice Cultivation in Asia Using the Rice Archaeological Database

Affiliations

Modelling the Geographical Origin of Rice Cultivation in Asia Using the Rice Archaeological Database

Fabio Silva et al. PLoS One. .

Abstract

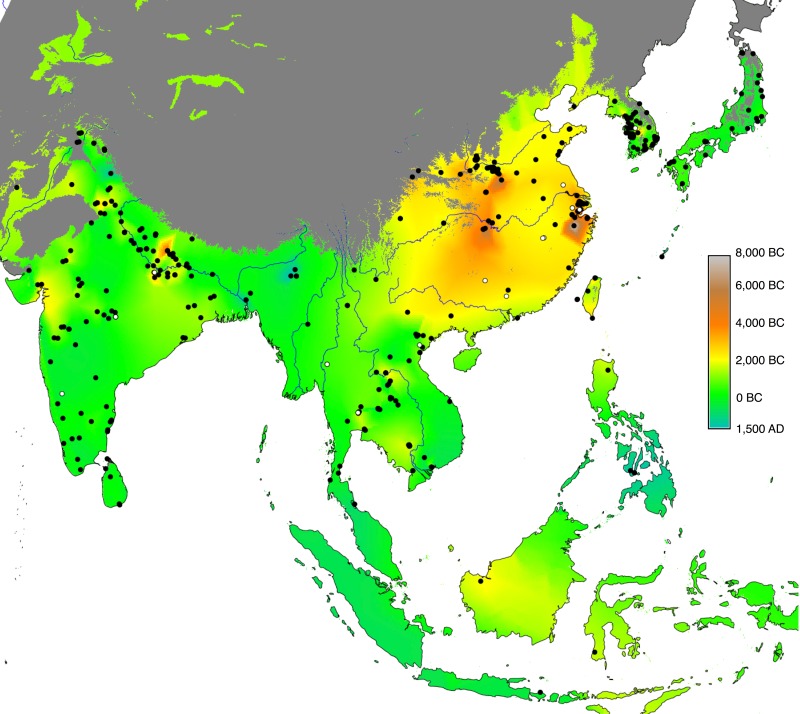
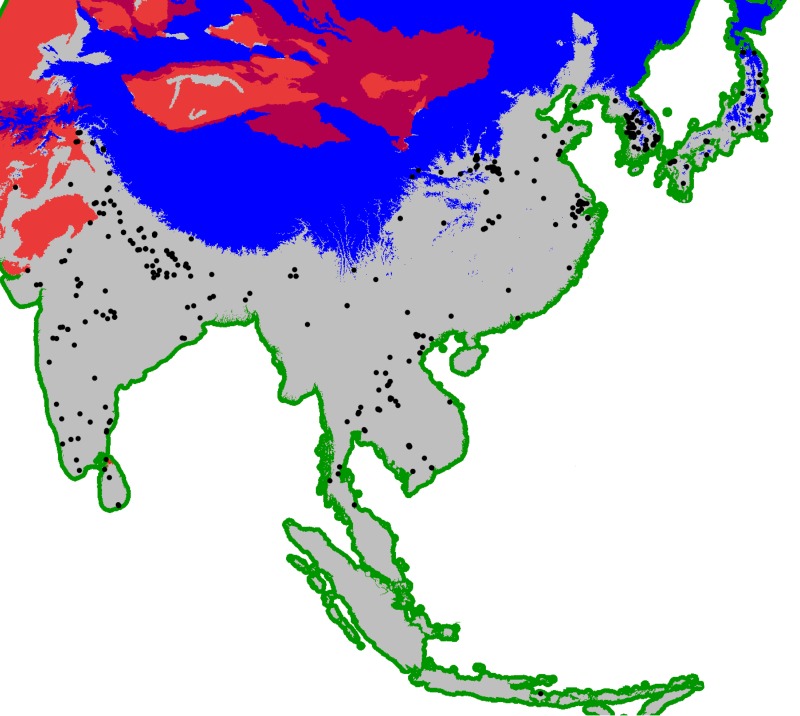
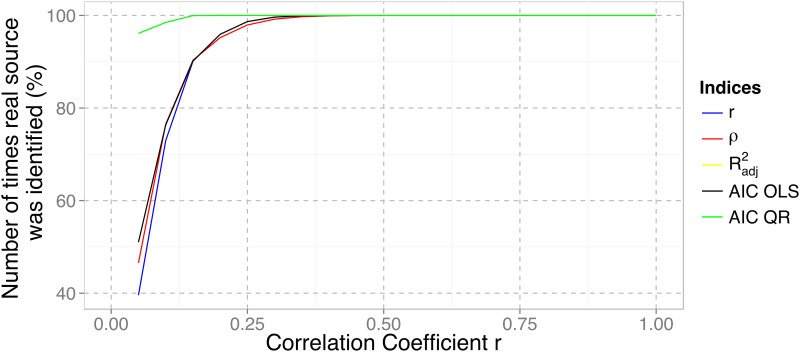
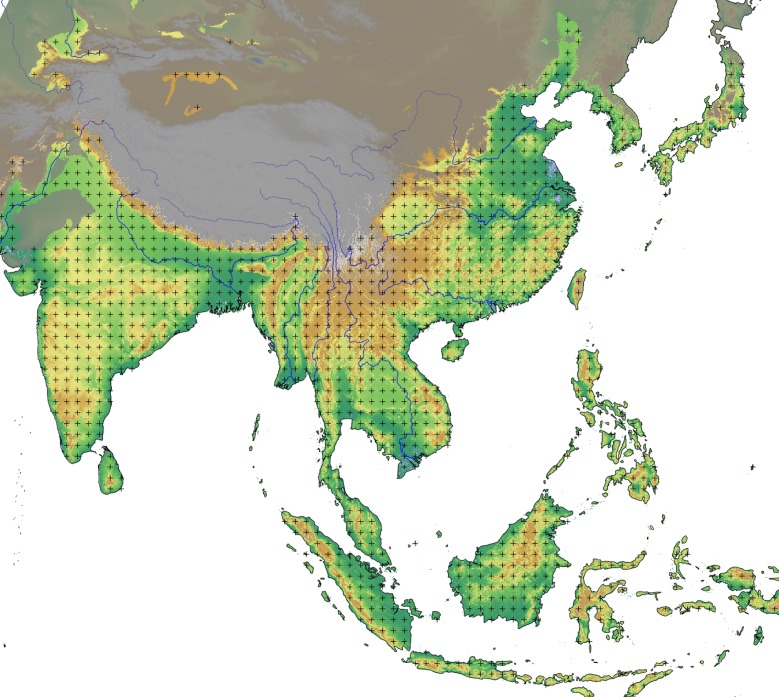
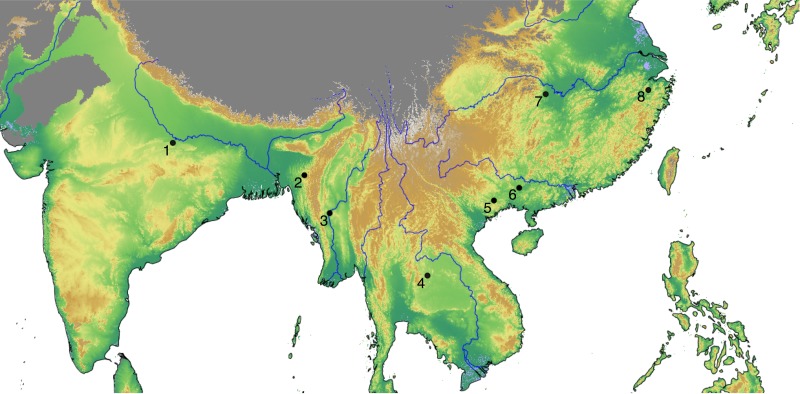
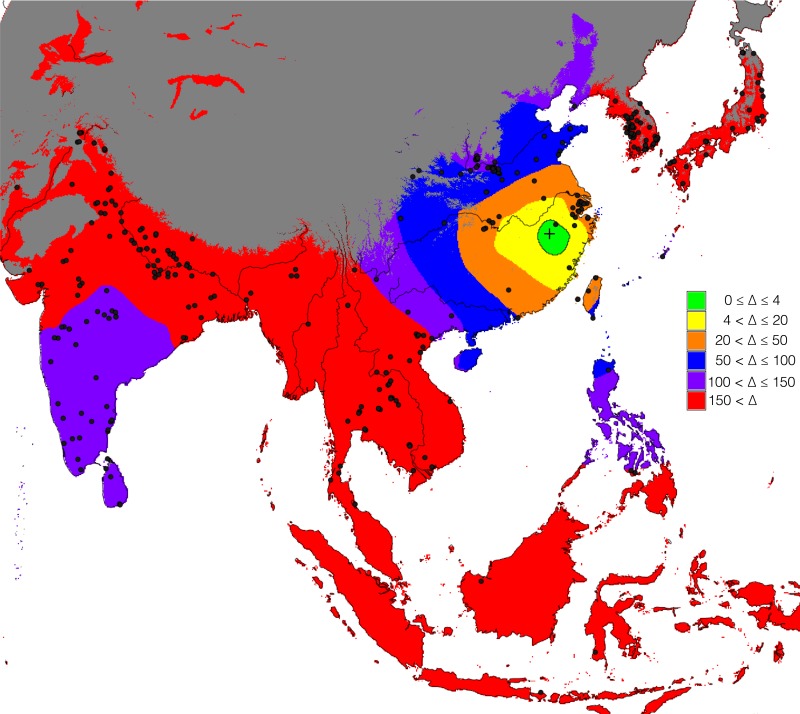
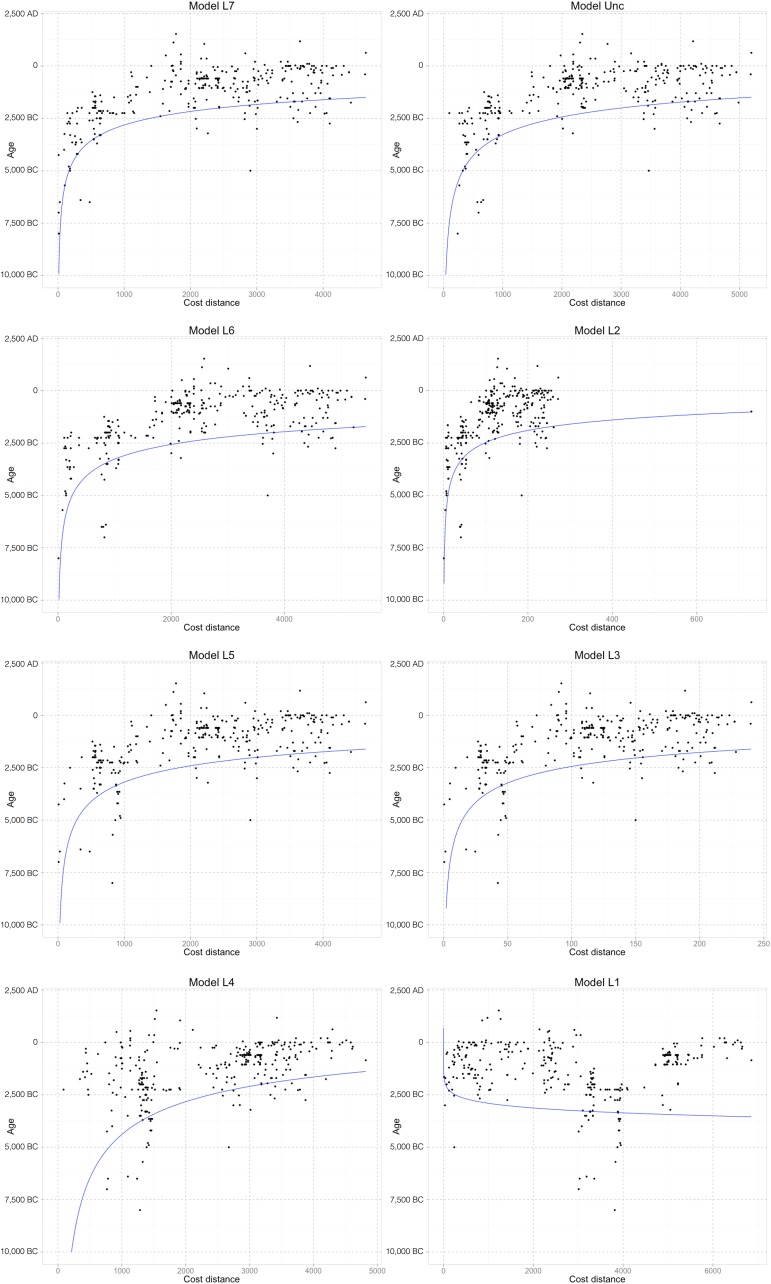
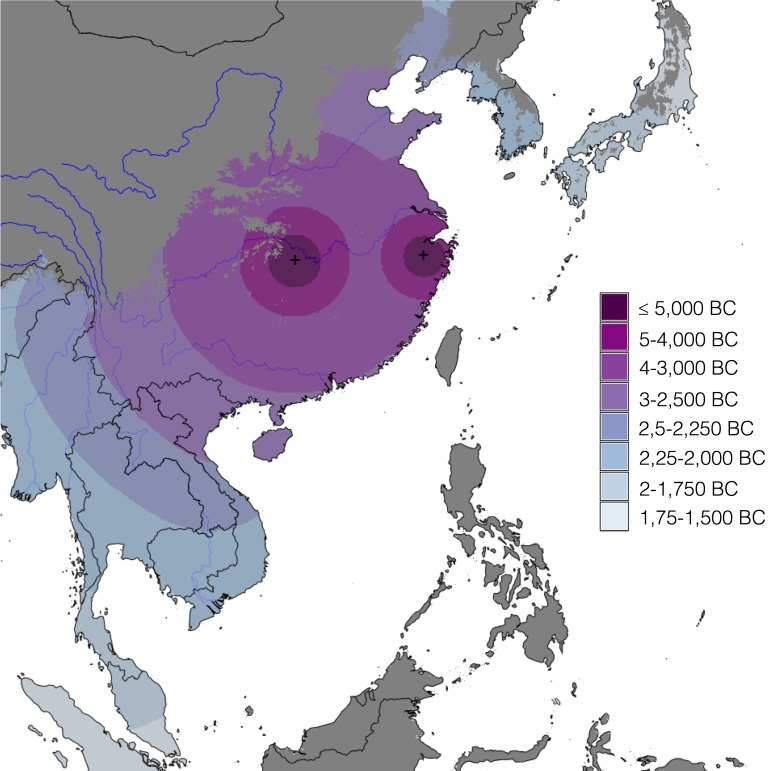
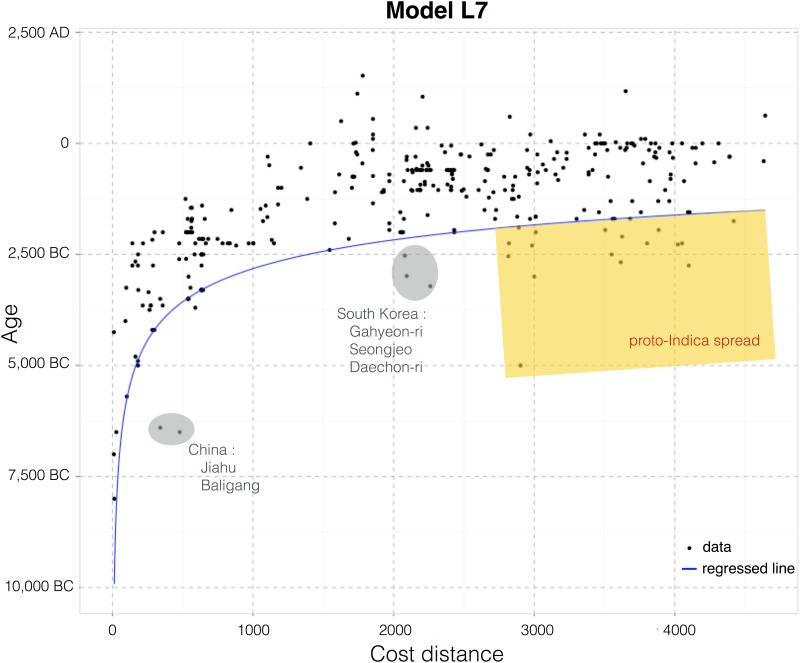
We have compiled an extensive database of archaeological evidence for rice across Asia, including 400 sites from mainland East Asia, Southeast Asia and South Asia. This dataset is used to compare several models for the geographical origins of rice cultivation and infer the most likely region(s) for its origins and subsequent outward diffusion. The approach is based on regression modelling wherein goodness of fit is obtained from power law quantile regressions of the archaeologically inferred age versus a least-cost distance from the putative origin(s). The Fast Marching method is used to estimate the least-cost distances based on simple geographical features. The origin region that best fits the archaeobotanical data is also compared to other hypothetical geographical origins derived from the literature, including from genetics, archaeology and historical linguistics. The model that best fits all available archaeological evidence is a dual origin model with two centres for the cultivation and dispersal of rice focused on the Middle Yangtze and the Lower Yangtze valleys.


Conflict of interest statement

Competing Interests: The authors have declared that no competing interests exist.

Figures

Fig 1
Fig 1. Map of the Rice Archaeological Database version 2.0.
Sites with cultivated rice are shown as filled black dots, whereas open ones represent archaeological sites with wild rice. The background layer shows the quantile interpolation of the median dates for the arrival of cultivated rice. The grey-shaded region has been excluded from the interpolation (see main text). Major rivers have been included for reference (source: ESRI World Major Rivers).
Fig 2
Fig 2. Domain used for the modelling.
Regions excluded were those with annual total number of degree-days lower than 2,500 (blue-shaded) and desert eco-regions (red-shaded). Kept were the landmass region (grey-shaded) and 40 km offshore buffers for coastal transport (green shaded). Database sites with cultivated rice retained for analysis marked as black dots.
Fig 3
Fig 3. Number of times the real dispersal source was selected by different fitness indices over a range of underlying correlation coefficients.
The R 2 adj curve (in yellow) is exactly the same, and therefore hidden behind, the AIC OLS curve (in black).
Fig 4
Fig 4. Map of the domain showing the gridpoints that were used in the unconstrained search for the best dispersal origin.
The region not included in the domain is grey-shaded. For reference, the background layer includes elevation data (source: USGS Shuttle Radar Topography Mission data), as well as major rivers (source: ESRI World Major Rivers).
Fig 5
Fig 5. Locations of the origins used in the tested literature models.
Specific archaeological sites: 1—Mahagara, 4—Non Nok Tha, 7- Pengtoushan, 8—Shangshan; general areas: 2—Assam, 3—Burma, 5—Northern Vietnam, 6—Pearl river delta. For reference, there is a background layer containing elevation data (source: USGS Shuttle Radar Topography Mission data) and the major rivers (source: ESRI World Major Rivers).
Fig 6
Fig 6. Interpolated map of ΔAIC values obtained from the results of the unconstrained search algorithm.
The gridpoint with lowest AIC is marked by the cross. The black dots mark the sites with cultivated rice in the Rice Archaeological Database. Major rivers are also shown, for reference (source: ESRI World Major Rivers).
Fig 7
Fig 7. Scatterplots of age with cost distance for all models considered.
The black dots represent records in the Rice Archaeological Database whereas the blue line represents the best-fitting log-log quantile regressed line for each model.
Fig 8
Fig 8. Predicted arrival times of cultivated rice in eastern and southeastern Asia, based on best-fitting model L7.
Areas in dark grey were not included in the modelling framework (see main text). Major rivers (source: ESRI World Major Rivers) and country borders shown for reference.
Fig 9
Fig 9. Scatterplot of the dataset for the best-fitting model L7.
The quantile interpolation of the 10th-percentile of the data (blue line) shows that the distribution follows a power law rule. Sites earlier than the model are circled and identified (see the text for related discussion).

References

    1. Bray F. The Rice Economies: Technology and Development in Asian Societies. Oxford: Blackwell; 1986.
    1. Gurou P. Riz et civilisation. Paris: Fayard; 1984.
    1. Scott JC. The Art of Not Being Governed: An Anarchist History of Upland Southeast Asia. New Haven: Yale University Press; 2009.
    1. Oka HI. Origins of Cultivated Rice. Oxford, New York and Tokyo: Japan Scientific Societies Press and Elsevier; 1988.
    1. Chang TT. Domestication and the spread of the cultivated rices In: Harris DR and Hillman GC, editors. Foraging and Farming: The Evolution of Plant Exploitation. London: Unwin Hyman; 1989. pp. 408–417.

Publication types

LinkOut - more resources