. 2015 Sep 1;12(9):e1001871.
doi: 10.1371/journal.pmed.1001871. eCollection 2015 Sep.

Asporin Is a Fibroblast-Derived TGF-β1 Inhibitor and a Tumor Suppressor Associated with Good Prognosis in Breast Cancer

Affiliations

Asporin Is a Fibroblast-Derived TGF-β1 Inhibitor and a Tumor Suppressor Associated with Good Prognosis in Breast Cancer

Pamela Maris et al. PLoS Med. .

Abstract

Background: Breast cancer is a leading malignancy affecting the female population worldwide. Most morbidity is caused by metastases that remain incurable to date. TGF-β1 has been identified as a key driving force behind metastatic breast cancer, with promising therapeutic implications.

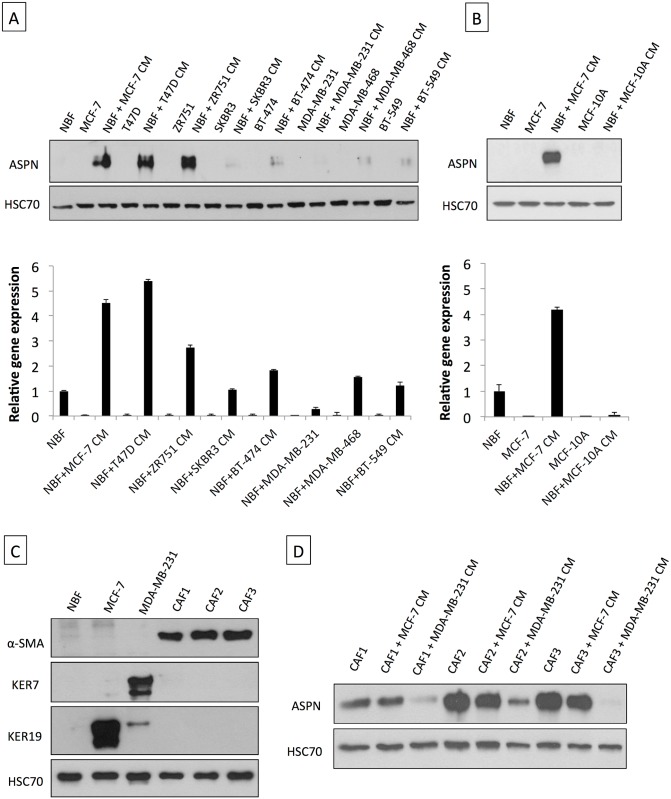
Methods and findings: Employing immunohistochemistry (IHC) analysis, we report, to our knowledge for the first time, that asporin is overexpressed in the stroma of most human breast cancers and is not expressed in normal breast tissue. In vitro, asporin is secreted by breast fibroblasts upon exposure to conditioned medium from some but not all human breast cancer cells. While hormone receptor (HR) positive cells cause strong asporin expression, triple-negative breast cancer (TNBC) cells suppress it. Further, our findings show that soluble IL-1β, secreted by TNBC cells, is responsible for inhibiting asporin in normal and cancer-associated fibroblasts. Using recombinant protein, as well as a synthetic peptide fragment, we demonstrate the ability of asporin to inhibit TGF-β1-mediated SMAD2 phosphorylation, epithelial to mesenchymal transition, and stemness in breast cancer cells. In two in vivo murine models of TNBC, we observed that tumors expressing asporin exhibit significantly reduced growth (2-fold; p = 0.01) and metastatic properties (3-fold; p = 0.045). A retrospective IHC study performed on human breast carcinoma (n = 180) demonstrates that asporin expression is lowest in TNBC and HER2+ tumors, while HR+ tumors have significantly higher asporin expression (4-fold; p = 0.001). Assessment of asporin expression and patient outcome (n = 60; 10-y follow-up) shows that low protein levels in the primary breast lesion significantly delineate patients with bad outcome regardless of the tumor HR status (area under the curve = 0.87; 95% CI 0.78-0.96; p = 0.0001). Survival analysis, based on gene expression (n = 375; 25-y follow-up), confirmed that low asporin levels are associated with a reduced likelihood of survival (hazard ratio = 0.58; 95% CI 0.37-0.91; p = 0.017). Although these data highlight the potential of asporin to serve as a prognostic marker, confirmation of the clinical value would require a prospective study on a much larger patient cohort.

Conclusions: Our data show that asporin is a stroma-derived inhibitor of TGF-β1 and a tumor suppressor in breast cancer. High asporin expression is significantly associated with less aggressive tumors, stratifying patients according to the clinical outcome. Future pre-clinical studies should consider options for increasing asporin expression in TNBC as a promising strategy for targeted therapy.


Conflict of interest statement

The authors have declared that no competing interests exist.

Figures

Fig 1
Fig 1. Asporin is overexpressed in breast cancer tissues.
(A) Tissue-specific pattern of mRNA expression of asporin (ASPN), biglycan (BGN), and decorin (DCN). Source: BioGPS (http://biogps.org). The data are presented as mean ± standard deviation (SD). (B) Representative IHC staining of asporin expression in ductal carcinoma and adjacent non-tumoral breast tissue (left panel) and normal breast tissue obtained from patients undergoing mammary reduction surgery (right panel). Asporin is almost exclusively expressed in breast cancer lesions, while a very low signal is detectable in the adjacent non-tumoral regions. Normal breast tissues are negative. Images of representative fields were taken at 100× and 400× magnification. (C) Western blot analysis of asporin expression in tumoral breast cancer tissues (T) and the adjacent normal counterpart (AdN) of six ductal adenocarcinoma patients. Ponceau red staining was used as loading control.
Fig 2
Fig 2. Asporin is produced by breast fibroblasts in response to conditioned medium from breast cancer cells.
(A) Western blot of total cell extracts (upper panel) and qRT-PCR analysis for asporin expression (lower panel) in breast cancer cell lines and NBFs incubated for 48 h with CM collected from a panel of breast cancer cells. (B) Western blot of total cell extracts (upper panel) and qRT-PCR analysis of asporin expression (lower panel) in non-cancerous epithelial breast cell line MCF-10A cells and NBFs incubated for 48 h with CM collected from MCF-10A. Fibroblasts treated with MCF-7 CM were used as the positive control for asporin expression induction. (C) Validation of NBFs and CAFs isolated from patient material. MCF-7 and MDA-MB-231 cells were used as epithelial controls. (D) Western blot analysis of asporin expression in total cell extracts of CAFs obtained from three different patients and treated with the CM of breast cancer cell lines. (A and B): The data are presented as mean ± SD. All panels: HSC70 was used as loading control; Western blots show representative data of three independent experiments.
Fig 3
Fig 3. Asporin expression is induced by TGF-β1 and suppressed by IL-1β.
(A) Western blot analysis of asporin expression in NBFs treated for 24 h with TGF-β1 with or without CM of MCF-7 and MDA-MB-231 breast cancer cells. (B) ELISA quantification of TGF-β1 levels secreted by human breast cancer cell lines during 48 h. (C) Differential in silico analysis of MCF-7 and MDA-MB-231 gene expression identifies a cluster of interleukins that are uniquely expressed in MDA-MB-231 cells (left panel). Analysis of IL-1β mRNA expression using GOBO (http://co.bmc.lu.se/gobo/gsa.pl) across a panel of breast cancer cell lines [35] subdivided into three subtypes (right panel). (D) Representative IHC analysis (upper panel) of IL-1β and asporin expression in a cohort of breast cancer patients, subdivided into two main subtypes (n = 20). Scoring and statistics (lower panel) were performed as outlined in the Methods section. (E) Inhibition of basal, MCF-7 CM-induced, and TGF-β1-induced asporin expression by IL-1β treatment of NBFs and CAFs. (F) Reversion of MDA-MB-231 CM inhibitory effect on asporin expression using IL-1β natural inhibitor IL-1RA. (B and D): The data are presented as mean ± SD. All panels: Western blots show representative data of three independent experiments.
Fig 4
Fig 4. Asporin binds to TGF-β1 and inhibits its downstream signaling and function.
(A) Western blot analysis of phospho-SMAD2 (p-SMAD2) and SMAD2 total protein extracts from MDA-MB-468 breast cancer cells treated for 15 min with TGF-β1 and/or human recombinant asporin (Rec. ASPN). (B) Western blot analysis of p-SMAD2 in total protein extracts from MDA-MB-468 breast cancer cells treated with TGF-β1 and/or asporin peptide corresponding to the 159–205 amino acid region (ASPNpep.). (C) Western blot analysis of p-SMAD2 and SMAD2 in total protein extracts from EpRAS cells treated for 15 min with TGF-β1 (5 ng/ml) and/or asporin peptide. (D) EMT induction in EpRAS cells in the presence of TGF-β1 and/or asporin peptide. EMT was monitored both at the phenotype level (upper panel) and using Western blot evaluation of VIM expression in total protein extracts from EpRAS cells (lower panel). (A–D): HSC70 was used as loading control. (E) Transwell migration assay of EpRAS cells pretreated with TGF-β1 (5 ng/ml) and/or asporin peptide (10 μg/ml). (F) Quantification of the CSC population in EpRAS cells following TGF-β1 and/or asporin peptide treatment. (E and F): The data are presented as mean ± SD. All panels: statistical significance was calculated using the Student’s t-test (as described in the Methods section). Western blots show representative data of three independent experiments.
Fig 5
Fig 5. Co-injection of cancer cells and fibroblasts overexpressing asporin reduces primary breast cancer tumor growth and lung metastasis formation in vivo.
(A) Western blot analysis of asporin expression in CM of MDA-MB-468 cells and in NBF stable clones used for subcutaneous injection in mice. Ponceau red is shown as loading control. (B) Bioluminescence imaging of control and asporin-expressing xenografts at day 28 after tumor engraftment. The color scale indicates the fluorescent intensity. (C) The volume (in cubic millimeters) of primary tumors measured weekly (from day 7 onwards). The data are presented as mean ± standard error of the mean (SEM) (n = 10 for each group). Statistical significance was calculated using Student’s t-test (**0.01 < p < 0.001; ***0.001 < p < 0.0001). (D) Human-specific Alu-PCR performed on genomic DNA isolated from dissected lungs was used to detect human cancer cells. The data are presented as mean ± SD. (E) Western blot analysis of asporin expression in mice primary tumors monitored for several weeks. HSC70 was used as loading control.
Fig 6
Fig 6. Asporin reduces primary breast cancer tumor growth and lung metastasis formation in vivo.
(A) Western blot analysis of asporin expression in the CM of MDA-MB-468 stable clones expressing asporin, used for subcutaneous injection in mice. Ponceau red is shown as loading control. (B) Bioluminescence imaging of control and asporin-expressing xenografts at day 28 after tumor engraftment (left panel). The color scale indicates the fluorescent intensity. The mean (± SEM) volume (in cubic millimeters) of primary tumors measured weekly (from day 14 onwards) for the time-matched cohort is also shown (n = 20 for each group) (right panel). Statistical significance was calculated using Student’s t-test (**0.01 < p < 0.001; ***0.001 < p < 0.0001). (C) Representative hematoxylin and eosin (H&E), asporin, and Ki67 IHC staining in MDA-MB-468 xenografts collected 7 wk post-engraftment. Control xenografts consistently displayed an invasion in the muscle layer (M). An extended necrotic (N) area was present in the peri-tumoral zone of MDA-MB-468-aspn mice tumors. (D) Quantification of the stem cell population in xenografted tumors expressing asporin using ALDH+ and CD44high/CD24low stemness markers (7 wk post-engraftment). (E) Post-operative follow-up of mice that had primary tumors removed at the same time (time-matched). (F) Mean (± SEM) volume (in cubic millimeters) of primary tumors measured weekly for the size-matched cohort (n = 20 for each group). (G) Post-operative follow-up of mice that had primary tumors removed at the same volume (size-matched). (E and G): IHC evaluation of vimentin in lung necropsies and quantification of metastatic deposits. All images of representative fields were taken at 40×, 100×, and 400× magnification. (D, E, and G): The data are presented as mean ± SD. Statistical significance was calculated using Student’s t-test.
Fig 7
Fig 7. High asporin expression in human breast cancer matches with luminal-like tumor type and good patient outcome.
(A) Representative IHC staining of asporin expression in human breast cancer tissues (upper panel). Box plots of asporin expression in 180 breast cancer patients with different status of HER2, ER, and PR are also shown (lower panel). The black line denotes the median expression, and the red line the mean expression. Significant differences in asporin expression were detected among all different subtypes of breast cancer. (B) Analysis of asporin mRNA expression in breast cancer tumors from different molecular subtypes (n = 1,280) and evaluation of asporin mRNA expression in breast cancer of different pathological grades (n = 1,411). (C) Representative IHC staining of asporin expression (upper panel), box plot showing the IHC score (middle panel) in breast cancer tissues from 60 patients with different outcomes, and ROC curve analysis of data obtained from 60 patients with different outcome (lower panel). Scoring and statistics were performed as outlined in the Methods section. (D) Kaplan-Meier survival curve based on asporin mRNA expression in untreated breast cancer with post-operative follow-up of 25 y (n = 375). Images in panels were taken at 100× magnification. All analyses outlined in (B) and (D) were performed using publicly deposited gene expression datasets [31,32] and according to procedures outlined in the Methods. AUC, area under the curve; HR, hazard ratio; SE, standard error.

Similar articles

Cited by

References

    1. Juntilla MR, de Sauvage FJ. Influence of tumour micro-environment heterogeneity on therapeutic response. Nature. 2013;501:346–354. 10.1038/nature12626 - DOI - PubMed
    1. Fiaschi T, Marini A, Giannoni E, Taddei ML, Gandellini P, De Donatis A, et al. Reciprocal metabolic reprogramming through lactate shuttle coordinately influences tumor-stroma interplay. Cancer Res. 2012;72:5130–5140. 10.1158/0008-5472.CAN-12-1949 - DOI - PubMed
    1. De Wever O, Van Bockstal M, Mareel M, Hendrix A, Bracke M. Carcinoma-associated fibroblasts provide operational flexibility in metastasis. Semin Cancer Biol. 2014;25C:33–46. - PubMed
    1. Dotto GP, Weinberg RA, Ariza A. Malignant transformation of mouse primary keratinocytes by Harvey sarcoma virus and its modulation by surrounding normal cells. Proc Natl Acad Sci U S A. 1988;85:6389–6393. - PMC - PubMed
    1. Shekhar MP, Werdell J, Santner SJ, Pauley RJ, Tait L. Breast stroma plays a dominant regulatory role in breast epithelial growth and differentiation: implications for tumor development and progression. Cancer Res. 2001;61:1320–1326. - PubMed

Publication types

MeSH terms