. 2015 Sep 22;6(28):25726-40.
doi: 10.18632/oncotarget.4535.

TNF signaling mediates an enzalutamide-induced metastatic phenotype of prostate cancer and microenvironment cell co-cultures

Affiliations

TNF signaling mediates an enzalutamide-induced metastatic phenotype of prostate cancer and microenvironment cell co-cultures

Kai Sha et al. Oncotarget. .

Abstract

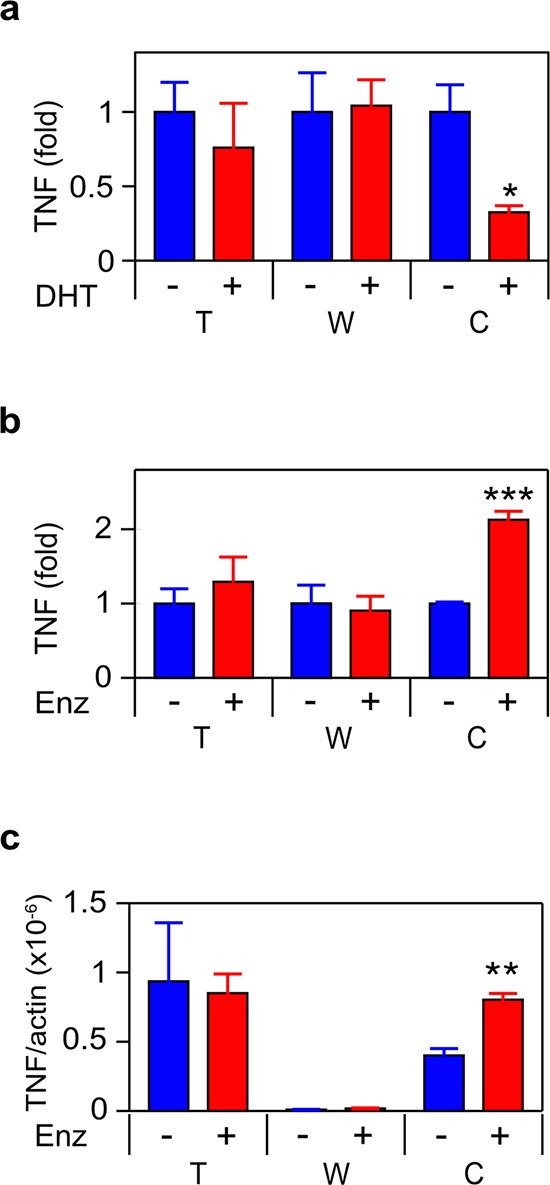
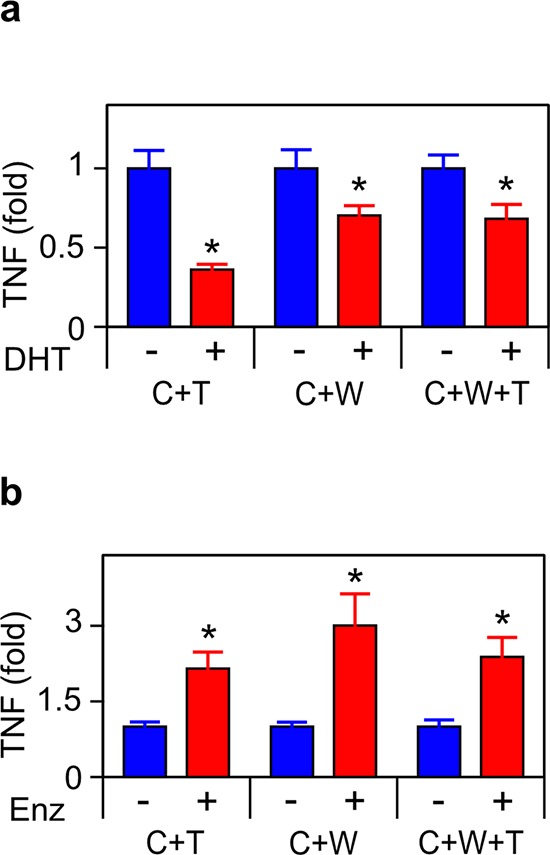
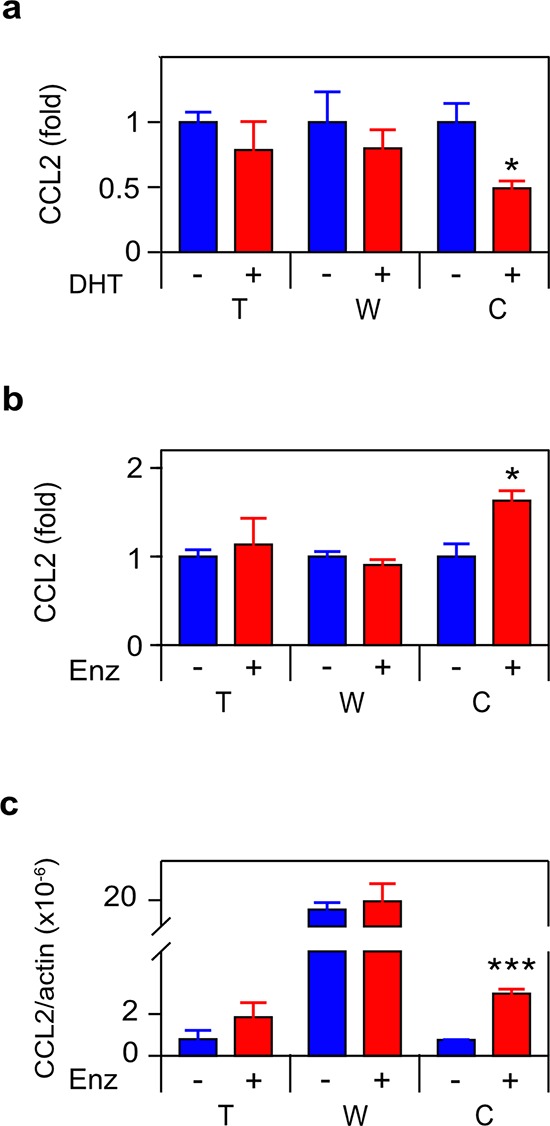
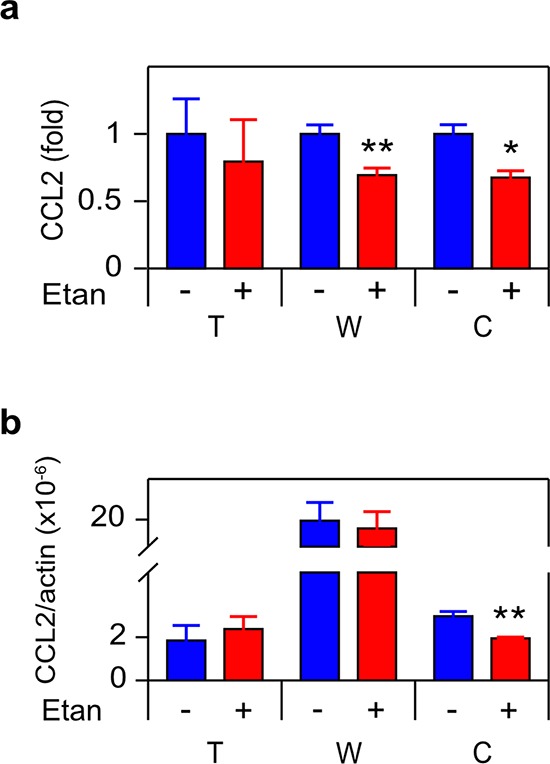
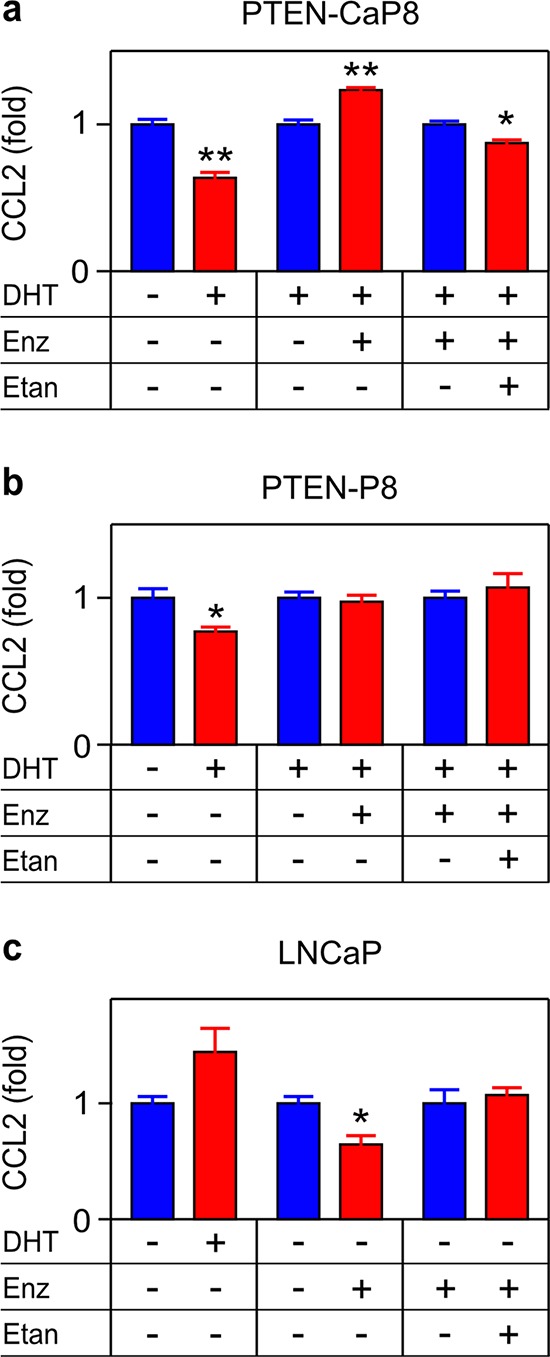
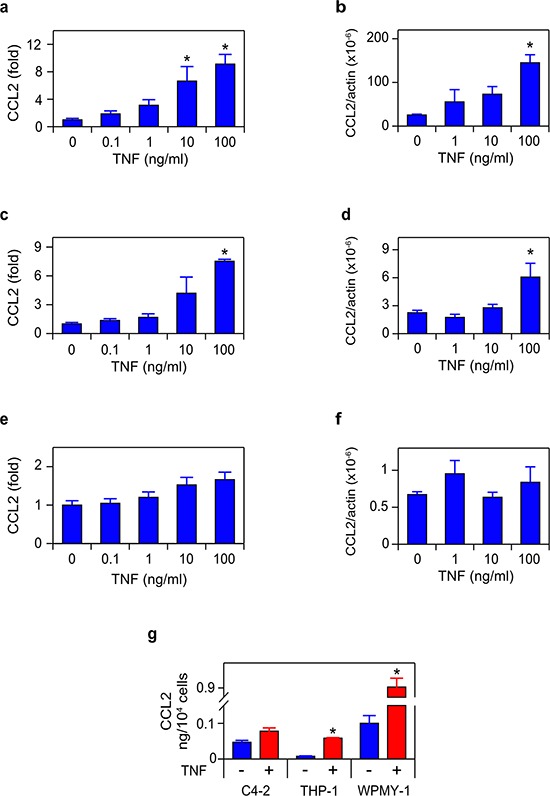
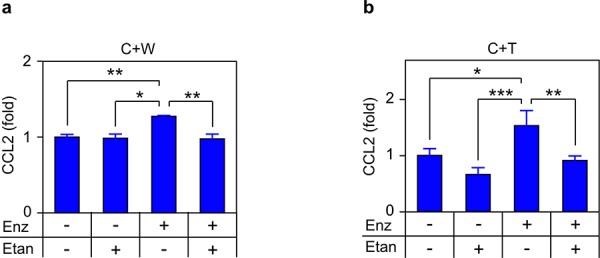
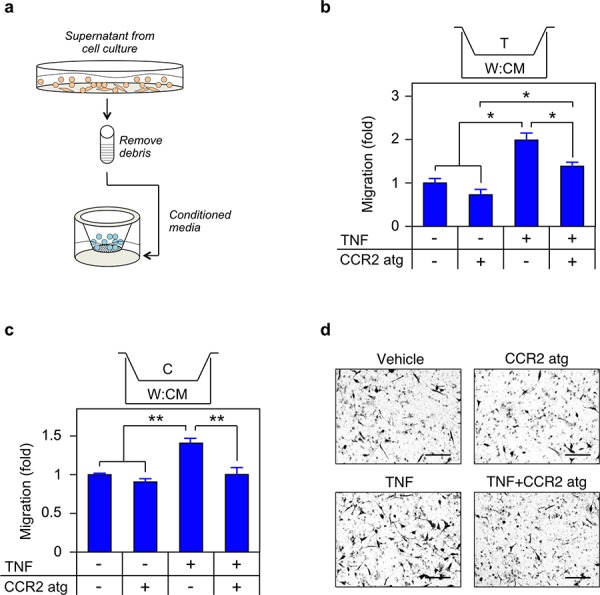
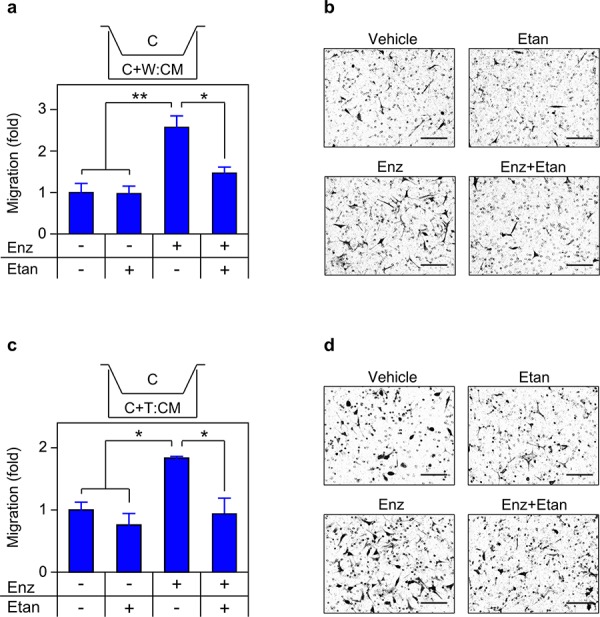
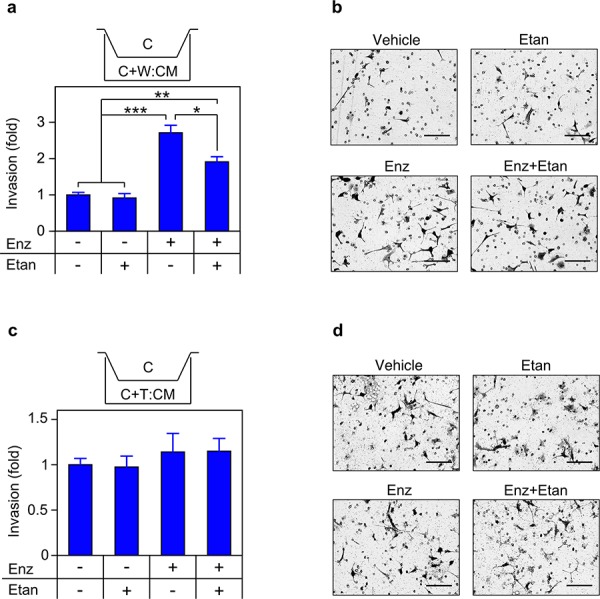
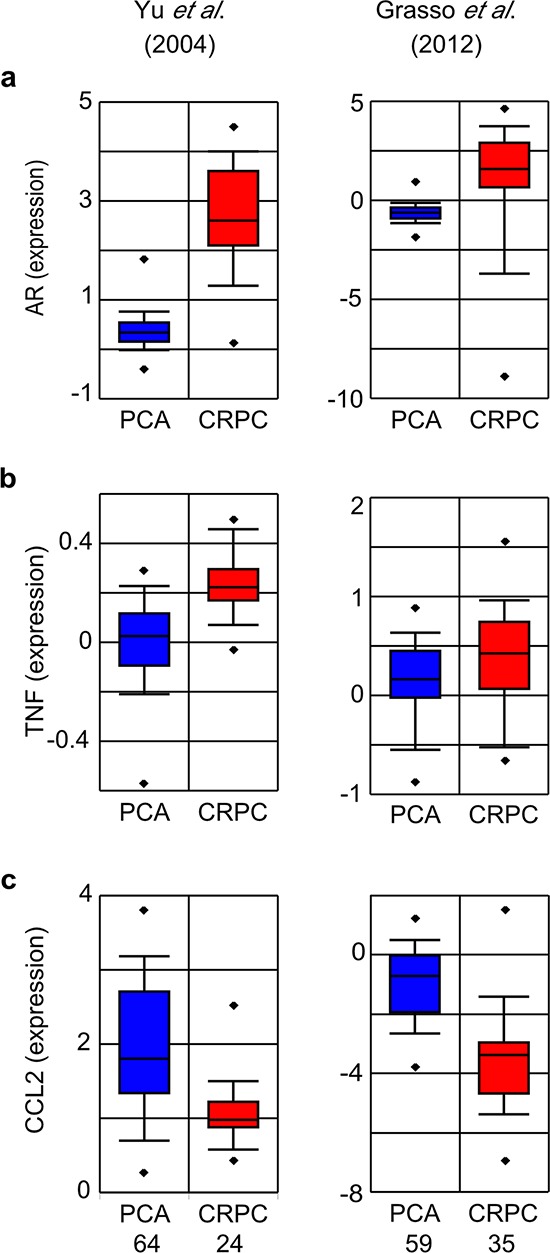
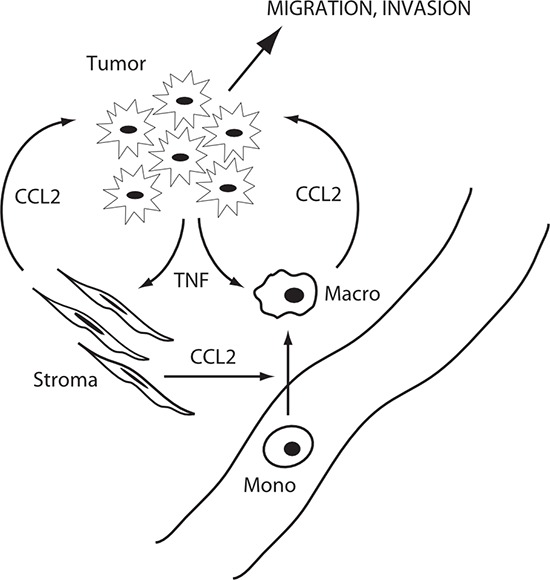
The dramatic responses tumors display to targeted therapies are limited by acquired or pre-existing mechanisms of therapy resistance. We recently discovered that androgen receptor blockade by the anti-androgen enzalutamide paradoxically enhanced metastasis and that these pro-metastatic effects were mediated by the chemoattractant CCL2. CCL2 is regulated by TNF, which is negatively regulated by androgen signaling. Thus, we asked if TNF mediates the pro-metastatic effects of enzalutamide. We found that androgen withdrawal or enzalutamide induced TNF mRNA and protein secretion in castration resistant prostate cancer (C4-2) cells, but not in macrophage-like (THP1) or myofibroblast-like (WPMY1) cells. Androgen deprivation therapy (ADT) induced autocrine CCL2 expression in C4-2 (as well as a murine CRPC cell line), while exogenous TNF induced CCL2 in THP1 and WPMY1. TNF was most potent in myofibroblast cultures, suggesting ADT induces CCL2 via paracrine interactions within the tumor microenvironment. A soluble TNF receptor (etanercept) blocked enzalutamide-induced CCL2 protein secretion and mRNA, implying dependence on secreted TNF. A small molecule inhibitor of CCR2 (the CCL2 receptor) significantly reduced TNF induced migration, while etanercept inhibited enzalutamide-induced migration and invasion of C4-2. Analysis of human prostate cancers suggests that a TNF-CCL2 paracrine loop is induced in response to ADT and might account for some forms of prostate cancer therapy resistance.

Keywords: CCL2; TNF; enzalutamide; metastasis; microenvironment.


Conflict of interest statement

CONFLICTS OF INTEREST

The authors declare no conflict of interest.

Figures

Figure 1
Figure 1. ADT induces TNF expression in CRPC
a. b. THP1 (T), WPMY-1 (W) or C4-2 (C) cells were treated for 72 h with vehicle (−) or 10 nM DHT (+) (a) or 10 μM enzalutamide (Enz; +) (b) TNF was assayed by ELISA (n ≥ 3). c. mRNA from cultures identical to (b) was quantitated by RT-PCR. TNF mRNA levels, normalized to Δ-actin, are shown (n = 3). Treated (red) and untreated (blue) cultures compared by Student's unpaired t-test. *p < 0.05, ***p < 0.001.
Figure 2
Figure 2. ADT induces TNF secretion in tumor/microenvironment co-cultures
Co-cultures, as indicated in Figure 1, were treated for 72 h with vehicle (−) or 10 nM DHT (+) a. or 10 μM enzalutamide (Enz) (+) b. TNF was assayed by ELISA (n = 3). Treated (red) and untreated (blue) cultures compared by Student's unpaired t-test. *p < 0.05.
Figure 3
Figure 3. ADT induces CCL2 expression in CRPC cells
a. b. Cells as indicated in Figure 1 were treated for 72 h with vehicle (−) or 10 nM DHT (+) (a) or 10 μM enzalutamide (Enz) (+) (b) CCL2 was assayed by ELISA (n ≥ 3). c. mRNA from cultures identical to (b) were quantitated by RT-PCR. CCL2 mRNA levels, normalized to Δ-actin, are shown (n = 3). Treated (red) and untreated (blue) cultures compared by Student's unpaired t-test. *p < 0.05, **p < 0.01.
Figure 4
Figure 4. TNF is required for enzalutamide-induced CCL2 expression in human CRPC
a. Cells indicated as in Figure 1 were cultured in the presence of 10 μM enzalutamide and either vehicle (−) or 1 μg/mL etanercept (Etan) (+), and assayed for CCL2 by ELISA 72 h later (n ≥ 3). b. mRNAs from cultures identical to a. were quantitated by RT-PCR. CCL2 mRNA levels, normalized to Δ-actin, are shown (n = 3). Treated (red) and untreated (blue) cultures compared by Student's unpaired t-test. *p < 0.05, **p < 0.01.
Figure 5
Figure 5. TNF is required for enzalutamide-induced CCL2 expression in a murine CRPC cell line
PTEN-CaP8 a. PTEN-P8 b. and LNCaP c. were treated with vehicle (−), 10 nM DHT (DHT, +), 10 μM enzalutamide (Enz, +) or 1 μg/mL etanercept (Etan, +) as indicated. Secreted CCL2 was measured by ELISA after 72 h (n ≥ 3). Treated (red) and untreated (blue) cultures compared by Student's unpaired t-test. *p < 0.05, **p < 0.01.
Figure 6
Figure 6. TNF induces CCL2 in microenvironment-derived cells
a. c. e. WPMY-1 (a) THP1 (c) and C4-2 (e) were treated with TNF for 72 h, as indicated. Secreted CCL2 was measured by ELISA (n = 3). b. d. f. RNA was extracted from WPMY-1 (b) THP-1 (d) and C4-2 (f) treated as in (a, c, e) CCL2 mRNA levels, normalized to Δ-actin, are shown (n = 3). g. The amount of CCL2 secreted by the indicated cell lines, following 72 h treatment with vehicle (red) or 100 ng/mL TNF (blue). Data re-plotted from (a, c, e) Differences were assessed by one-way ANOVA, followed by Tukey-Kramer HSD test (a–f). *p < 0.05.
Figure 7
Figure 7. TNF is required for enzalutamide-induced CCL2 secretion in co-cultures
Mixed cultures of C4-2 plus WPMY-1 (C+W;) a. or C4-2 PCa plus THP1 (C+T;) b. were treated with vehicle (−), 10 μM enzalutamide (Enz, +) or 1 μg/mL etanercept (Etan, +) for 72 h, as indicated. Secreted CCL2 was measured by ELISA (n ≥ 3). Differences were assessed by one-way ANOVA followed by Tukey-Kramer HSD test. *p < 0.05, **p < 0.01, ***p < 0.001.
Figure 8
Figure 8. TNF induced CCL2 signaling is required for migration
a. Schematic of migration assay. b. c. THP1 (b) or C4-2 (c) were seeded in the upper chamber and migration determined as in Materials and Methods (n = 3). CM was from cells grown for 72 h in media plus vehicle (−) or 100 ng/mL TNF (TNF, +). The CCR2 antagonist (CCR2 atg, +) was added to the CM, as indicated. d. Representative photomicrographs of migrated C4-2 cells from (c) Magnification, 460 ×; scale bar, 100 μm. Differences were assessed by one-way ANOVA followed by Tukey-Kramer HSD test. *p < 0.05, **p < 0.01.
Figure 9
Figure 9. Secreted TNF is required for enzalutamide-induced migration
a. c. Transwell migration assays were performed as in Figure 8, with C4-2 cells seeded in the upper chamber and migration determined as in Materials and Methods (n = 3). CM derived from mixed cultures of C4-2/WPMY-1 (a) or C4-2/THP1 (c) grown for 72 h in the presence of vehicle (−), 10 μM enzalutamide (Enz, +) or 1 μg/mL etanercept (Etan; +), as indicated. b. d. Representative photomicrographs of migrated C4-2 cells from (a) and (c) respectively. Magnification, 460x; scale bar, 100 μm. Differences were assessed by one-way ANOVA followed by Tukey-Kramer HSD test. *p < 0.05, **p < 0.01
Figure 10
Figure 10. Secreted TNF is required for enzalutamide-induced invasion
a. c. Transwell invasion assays were performed, essentially identical to Figure 9, except that transwell membranes were coated with Matrigel, (n = 3). b. d. Representative photomicrographs of cells that have invaded the Matrigel coated membrane, from (a) and (c) respectively. Magnification, 460 ×; scale bar, 100 μm. Statistical comparison by one-way ANOVA followed by Tukey-Kramer HSD test. *p < 0.05, **p < 0.01, ***p < 0.001
Figure 11
Figure 11. TNF, CCL2 and AR mRNA expression in metastatic CRPC
Oncomine was used to generate box plots of AR a. TNF b. and CCL2 c. mRNA expression in human primary PCa (blue) and CRPC (red) from the indicated data sets. Sample size as indicated (bottom), with the exception that the Grass et al. data set contains only 34 (rather than 35) samples for the TNF probe. PCa and CRPC sample sets were compared by Student's unpaired t-test. p < 10−5, except b. Grasso et al., p = 0.02.
Figure 12
Figure 12. Schematic of microenvironment interactions
Tumor cells produce TNF in response to ADT, which induces CCL2 in stromal cells and macrophages, and promotes tumor cell migration and invasion and monocyte migration and differentiation to macrophages.

Similar articles

Cited by

References

    1. Weinstein IB. Cancer. Addiction to oncogenes—the Achilles heal of cancer. Science. 2002;297:63–64. - PubMed
    1. Sawyers C. Targeted cancer therapy. Nature. 2004;432:294–297. - PubMed
    1. Lackner MR, Wilson TR, Settleman J. Mechanisms of acquired resistance to targeted cancer therapies. Future oncology. 2012;8:999–1014. - PubMed
    1. Kwak EL, Sordella R, Bell DW, Godin-Heymann N, Okimoto RA, Brannigan BW, Harris PL, Driscoll DR, Fidias P, Lynch TJ, Rabindran SK, McGinnis JP, Wissner A, et al. Irreversible inhibitors of the EGF receptor may circumvent acquired resistance to gefitinib. Proc Natl Acad Sci U S A. 2005;102:7665–7670. - PMC - PubMed
    1. Pao W, Miller VA, Politi KA, Riely GJ, Somwar R, Zakowski MF, Kris MG, Varmus H. Acquired resistance of lung adenocarcinomas to gefitinib or erlotinib is associated with a second mutation in the EGFR kinase domain. PLoS medicine. 2005;2:e73. - PMC - PubMed

Publication types

MeSH terms