. 2015 Sep 1;11(9):e1005135.
doi: 10.1371/journal.ppat.1005135. eCollection 2015 Sep.

KSHV Latency Locus Cooperates with Myc to Drive Lymphoma in Mice

Affiliations

KSHV Latency Locus Cooperates with Myc to Drive Lymphoma in Mice

Sang-Hoon Sin et al. PLoS Pathog. .

Abstract

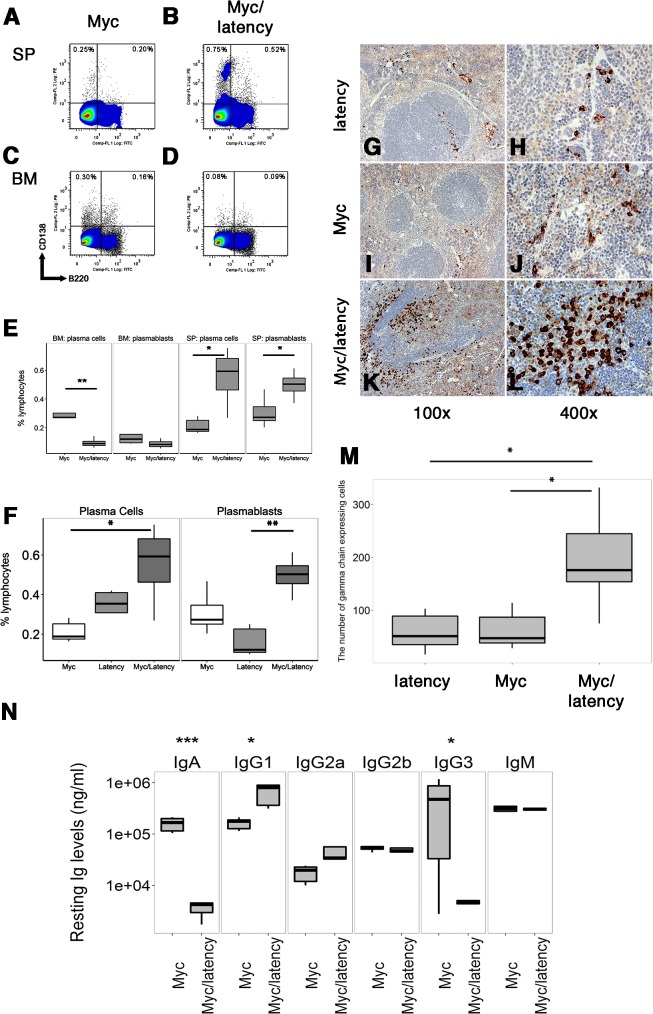
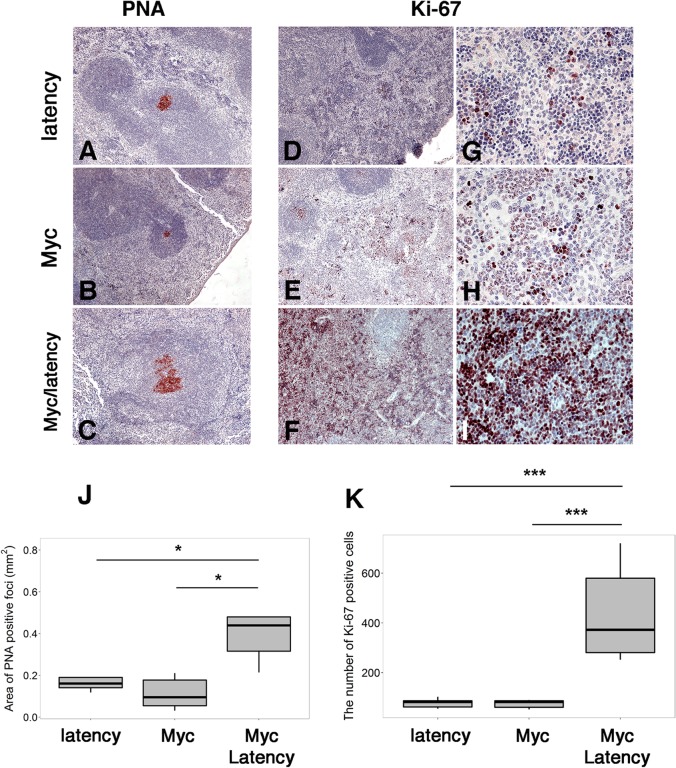
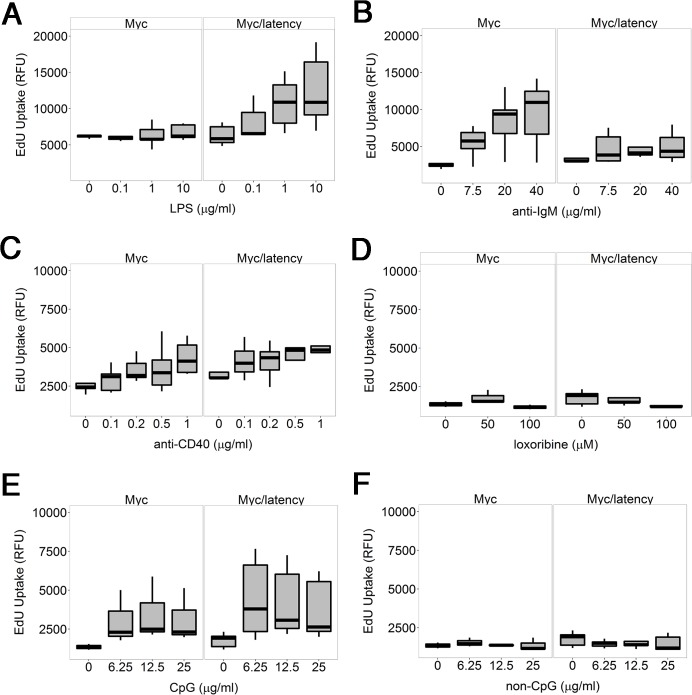
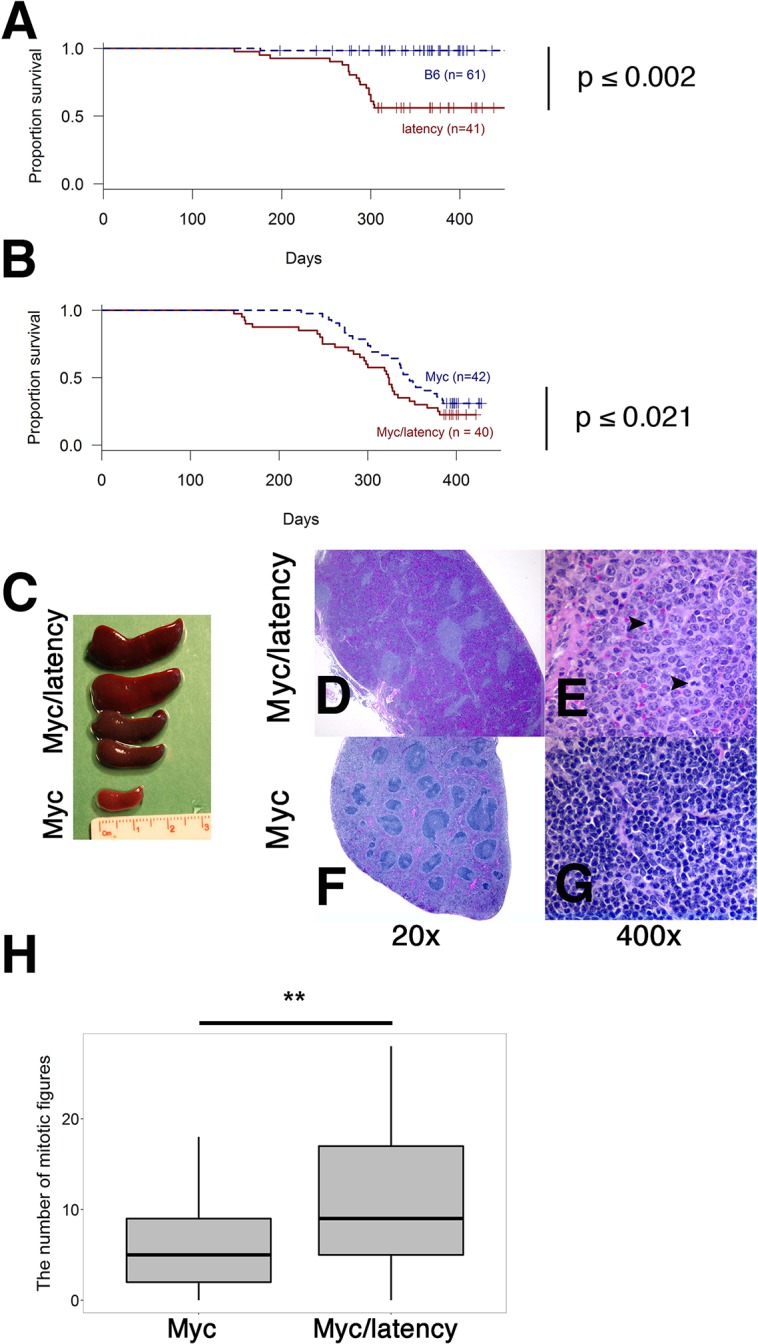
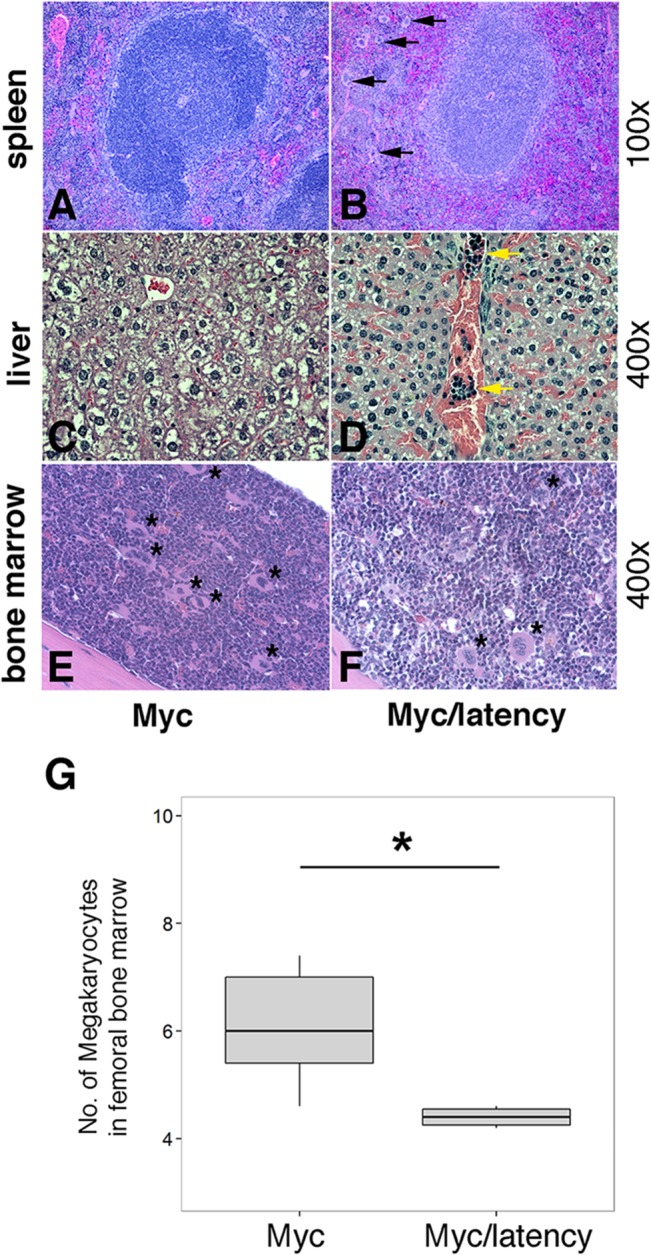
Kaposi sarcoma-associated herpesvirus (KSHV) has been linked to Kaposi sarcoma and B-cell malignancies. Mechanisms of KSHV-induced oncogenesis remain elusive, however, in part due to lack of reliable in vivo models. Recently, we showed that transgenic mice expressing the KSHV latent genes, including all viral microRNAs, developed splenic B cell hyperplasia with 100% penetrance, but only a fraction converted to B cell lymphomas, suggesting that cooperative oncogenic events were missing. Myc was chosen as a possible candidate, because Myc is deregulated in many B cell lymphomas. We crossed KSHV latency locus transgenic (latency) mice to Cα Myc transgenic (Myc) mice. By itself these Myc transgenic mice develop lymphomas only rarely. In the double transgenic mice (Myc/latency) we observed plasmacytosis, severe extramedullary hematopoiesis in spleen and liver, and increased proliferation of splenocytes. Myc/latency mice developed frank lymphoma at a higher rate than single transgenic latency or Myc mice. These data indicate that the KSHV latency locus cooperates with the deregulated Myc pathways to further lymphoma progression.


Conflict of interest statement

The authors have declared that no competing interests exist.

Figures

Fig 1
Fig 1. Increased frequency of PCs in Myc/latency mice.
Cells were isolated from spleen or BM from 7–11 week-old Myc (n = 5) or the Myc/latency (n = 5) mice and analyzed using flow cytometry. Lymphocytes in spleen or BM were pregated based on CD19 expression. CD19- cells were further gated using CD138 and B220. Representative FACS plots of PBs and PCs were shown. (A-B) Splenic PBs (CD19-B220+CD138+) and PCs (CD19-B220-CD138+). (C-D) PBs and PCs in BM. (E) The percentages of PBs or PCs are shown. Splenic plasmacytosis induced by increased PCs was further confirmed by immunostaining with γ heavy-chain. (F) Comparison of splenic PBs and PCs frequencies from the latency (n = 5), Myc (n = 5), and Myc/latency (n = 5) mice. Splenic cells were isolated from 7–11 week-old mice and analyzed by flow cytometry. Igγ chain staining was performed for spleen sections from the latency mouse (n = 5; G-H), single transgenic Myc mouse (n = 5; I-J), and double transgenic Myc/latency mouse (n = 5; K-L). Representative images were shown. (M) The number of Igγ chain positive cells from 400X images (n = 5 for all genotypes) was counted and plotted. (N) Isotype-specific Ig regulation by KSHV latency locus in overexpressed Myc background. Levels of Igs were measured by ELISA and plotted from the Myc mice (n = 6), and Myc/latency (n = 5). *, **, and *** represent significant difference with p ≤ 0.05, p ≤ 0.005, p ≤ 0.0005 by ANOVA, respectively.
Fig 2
Fig 2. Augmented proliferation in Myc/latency mice.
(A-C) PNA staining of spleen sections from the latency (n = 5) or the Myc (n = 5) or the Myc/ latency (n = 5). Ki-67 staining of spleen sections from the latency (D, G; n = 5) or the Myc (E, H; n = 5) or the Myc/ latency (F, I; n = 5). Representative images are shown. (J) The area of PNA-positive foci from panels A-C was plotted. (K) The number of Ki-67 positive cells from panels G-I was plotted. * and *** represent significant difference with p ≤ 0.05, and p ≤ 0.0005 by ANOVA, respectively.
Fig 3
Fig 3. KSHV latency locus confers hyper-responsiveness to LPS in the environment of forced Myc overexpression.
Proliferation was evaluated by incorporation of 5-ethynyl-2'-deoxyuridine (EdU) into DNA. Splenic B cells from the transgenic (n = 5) and wild-type mice (n = 5) were cultured with varying doses of LPS (A), or anti-IgM (B), or anti-CD40 antibody (C), or loxoribine (D), or CpG (E), or non-CpG (F) for 72 hours. Relative fluorescence unit (RFU) was measured and is expressed as ex vivo cell proliferation.
Fig 4
Fig 4. Augmented tumorigenicity by cooperation of KSHV latency locus and Myc.
(A-B) Survival plot of the wild-type (C57BL/6) and latency, and the Myc and Myc/latency mouse cohorts. (C) Splenomegaly was observed in the Myc/latency mice. (D-E) Spleen section was shown and mitotic figures (black arrows) were found in the Myc/latency mouse. H&E staining. (F-G) Normal splenic architecture was presented in the Myc mouse. H&E staining. Representative images are shown. (H) Mitotic figures were counted for 5 high power field images (400X) per sample (42 for Myc and 40 for Myc/latency mice). ** represents significant difference with p ≤ 0.005 by ANOVA.
Fig 5
Fig 5. Severe EMH in the Myc/latency mice.
(A-B) Severe EMH was found in spleen in the Myc/latency mice. Black arrow represents megakaryocyte. H&E staining. (C-D) Liver from the Myc/latency mice showed severe EMH. Yellow arrow indicates cluster of erythroid precursors in portal vein. H&E staining. (E-F) Decreased hematopoiesis was found in femoral BM from the Myc/latency mice. Black asterisk represents megakaryocyte. (G) The number of megakaryocytes was counted in 5 high field images (400X) per femoral BM section from 6 mice per each genotype and plotted. H&E staining. Representative images are shown.

Similar articles

Cited by

References

    1. Meyer N, Penn LZ (2008) Reflecting on 25 years with MYC. Nat Rev Cancer 8: 976–990. 10.1038/nrc2231 - DOI - PubMed
    1. Jaffe ES, Pittaluga S (2011) Aggressive B-cell lymphomas: a review of new and old entities in the WHO classification. Hematology / the Education Program of the American Society of Hematology American Society of Hematology Education Program 2011: 506–514. 10.1182/asheducation-2011.1.506 - DOI - PMC - PubMed
    1. Ott G, Rosenwald A, Campo E (2013) Understanding MYC-driven aggressive B-cell lymphomas: pathogenesis and classification. Blood 122: 3884–3891. 10.1182/blood-2013-05-498329 - DOI - PubMed
    1. Valera A, Colomo L, Martinez A, de Jong D, Balague O, et al. (2013) ALK-positive large B-cell lymphomas express a terminal B-cell differentiation program and activated STAT3 but lack MYC rearrangements. Mod Pathol 26: 1329–1337. 10.1038/modpathol.2013.73 - DOI - PMC - PubMed
    1. Adams JM, Harris AW, Pinkert CA, Corcoran LM, Alexander WS, et al. (1985) The c-myc oncogene driven by immunoglobulin enhancers induces lymphoid malignancy in transgenic mice. Nature 318: 533–538. - PubMed

Publication types

MeSH terms

LinkOut - more resources