. 2015 Sep 1;5(9):e632.
doi: 10.1038/tp.2015.136.

R-ketamine: a rapid-onset and sustained antidepressant without psychotomimetic side effects

Affiliations

R-ketamine: a rapid-onset and sustained antidepressant without psychotomimetic side effects

C Yang et al. Transl Psychiatry. .

Erratum in

Abstract

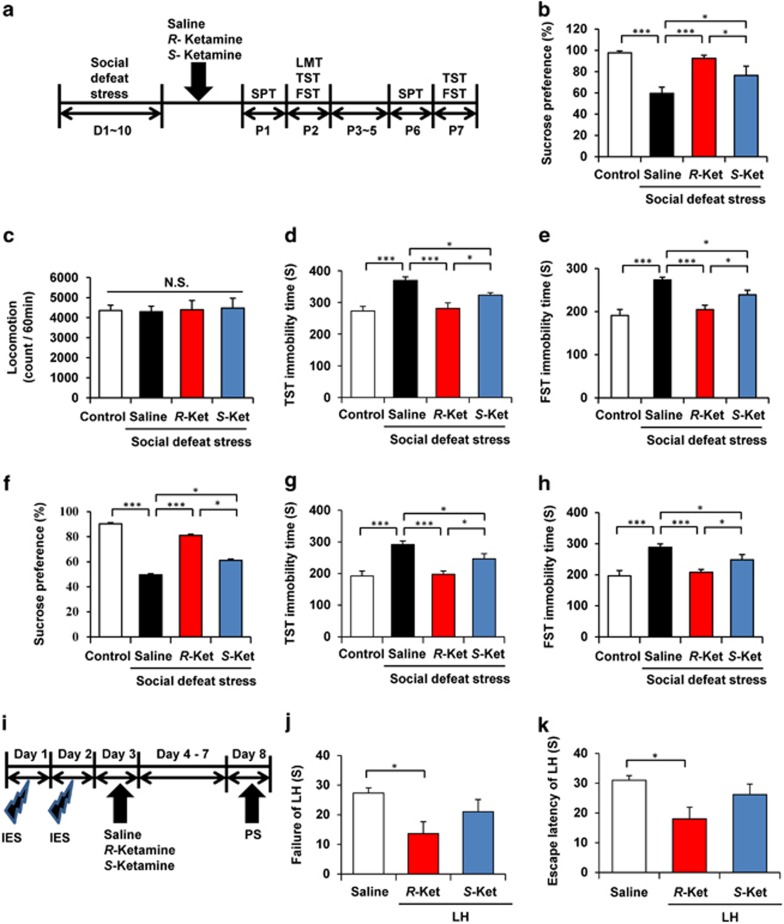
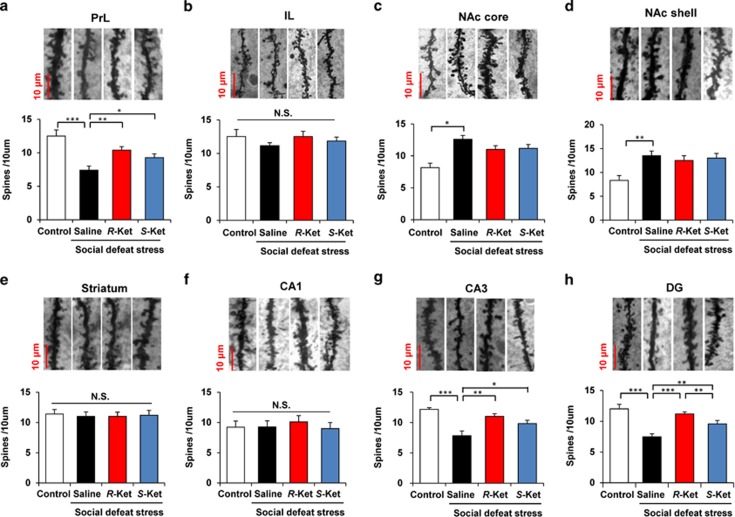
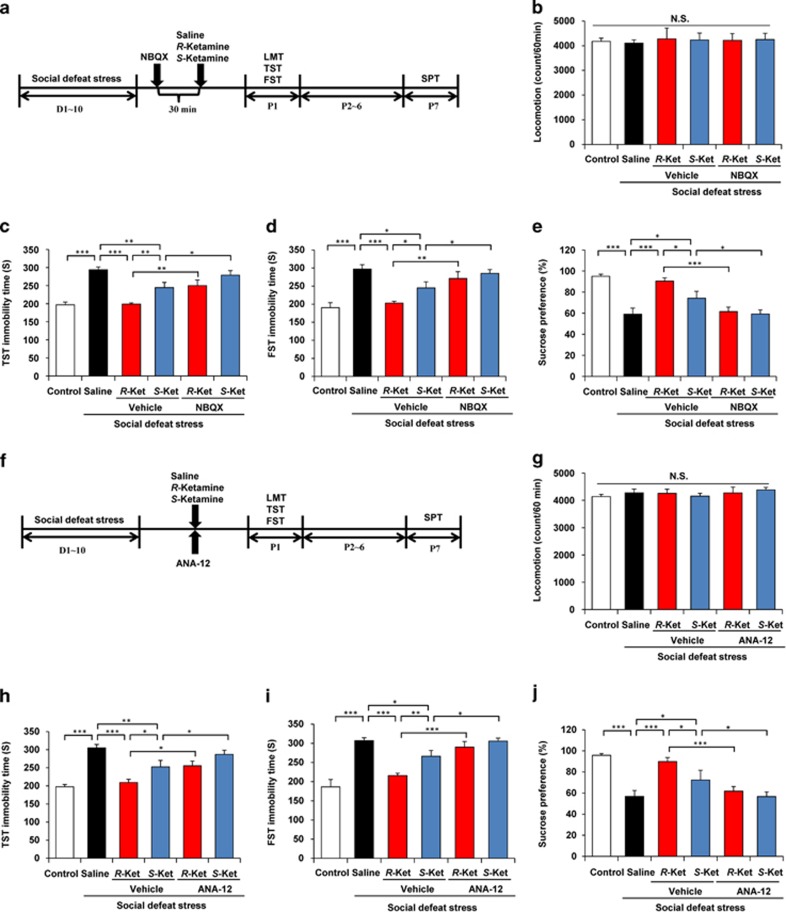
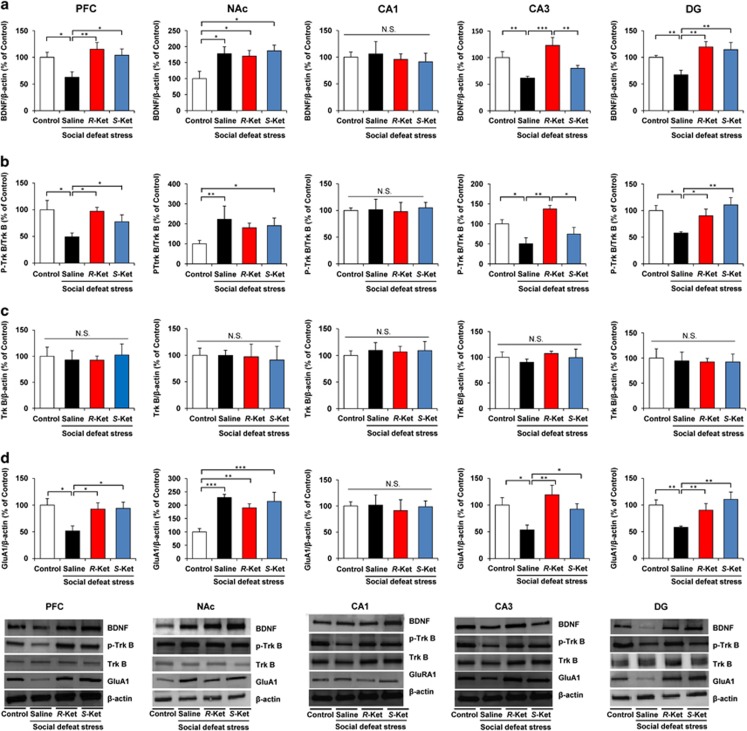
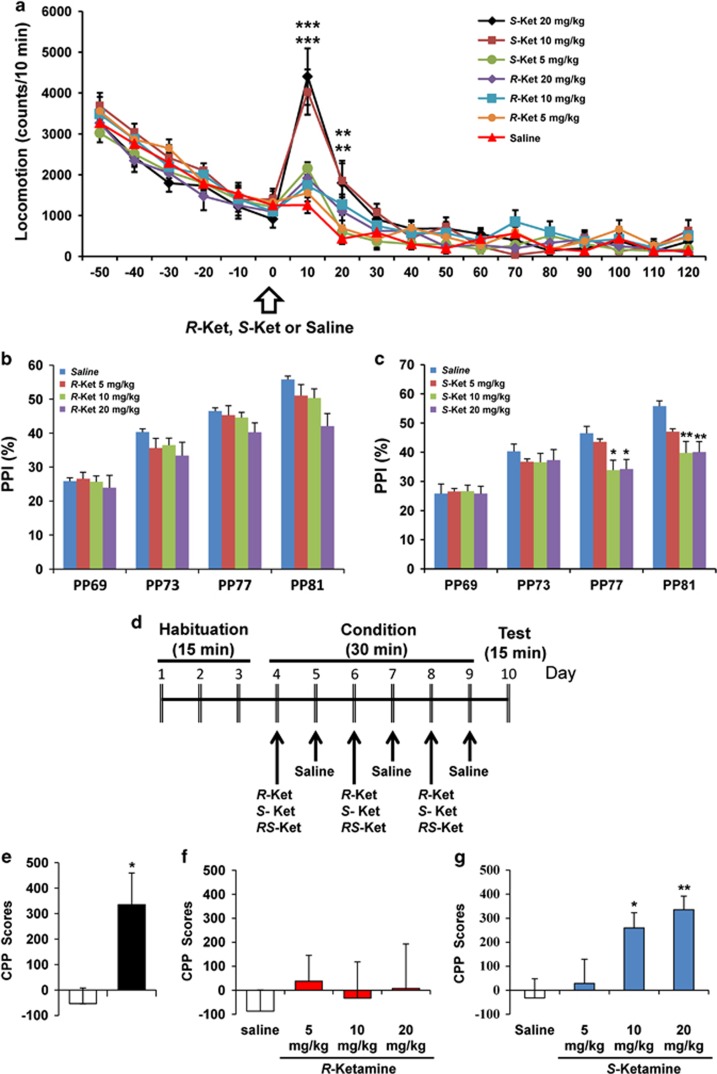
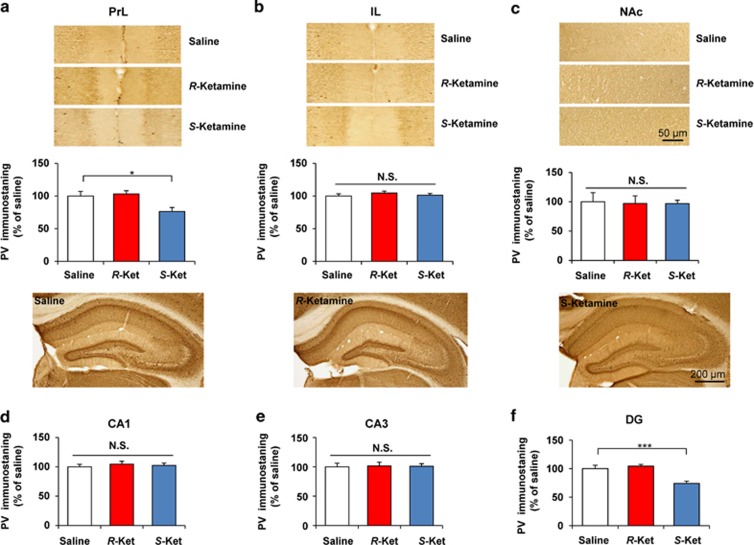
Although the efficacy of racemate ketamine, a rapid onset and sustained antidepressant, for patients with treatment-resistant depression was a serendipitous finding, clinical use of ketamine is limited, due to psychotomimetic side effects and abuse liability. Behavioral and side-effect evaluation tests were applied to compare the two stereoisomers of ketamine. To elucidate their potential therapeutic mechanisms, we examined the effects of these stereoisomers on brain-derived neurotrophic factor (BDNF)-TrkB signaling, and synaptogenesis in selected brain regions. In the social defeat stress and learned helplessness models of depression, R-ketamine showed a greater potency and longer-lasting antidepressant effect than S-ketamine (esketamine). Furthermore, R-ketamine induced a more potent beneficial effect on decreased dendritic spine density, BDNF-TrkB signaling and synaptogenesis in the prefrontal cortex (PFC), CA3 and dentate gyrus (DG) of the hippocampus from depressed mice compared with S-ketamine. However, neither stereoisomer affected these alterations in the nucleus accumbens of depressed mice. In behavioral tests for side effects, S-ketamine, but not R-ketamine, precipitated behavioral abnormalities, such as hyperlocomotion, prepulse inhibition deficits and rewarding effects. In addition, a single dose of S-ketamine, but not R-ketamine, caused a loss of parvalbumin (PV)-positive cells in the prelimbic region of the medial PFC and DG. These findings suggest that, unlike S-ketamine, R-ketamine can elicit a sustained antidepressant effect, mediated by increased BDNF-TrkB signaling and synaptogenesis in the PFC, DG and CA3. R-ketamine appears to be a potent, long-lasting and safe antidepressant, relative to S-ketamine, as R-ketamine appears to be free of psychotomimetic side effects and abuse liability.


Conflict of interest statement

Dr Hashimoto is an inventor on a filed patent application on 'The use of R-ketamine in the treatment of psychiatric diseases' by Chiba University. Dr Hashimoto has served as a scientific consultant to Astellas and Taisho, and he has also received research support from Abbvie, Dainippon Sumitomo, Mochida, Otsuka and Taisho. Dr Shirayama has received research support from Eli Lilly, Eisai, MSD, Otsuka, Pfizer, Taisho, Takeda and Mitsubishi-Tanabe. The remaining authors declare no conflict of interest.

Figures

Figure 1
Figure 1
Antidepressant effects of R-ketamine and S-ketamine in social defeat stress and LH models of depression. (a) The schedule of social defeat stress model and behavioral tests after treatment. (b) One percent SPT was performed 1 day after a single dose of saline, R-ketamine (10 mg kg−1) or S-ketamine (10 mg kg−1) (one-way ANOVA, F3,42=11.05, P=0.002). (ce) Behavioral tests, including LMT (F3,35=0.038, P=0.99), TST (F3,34=12.046, P<0.001) and FST (F3,34=13.235, P<0.001), were performed 2 days after a single dose. (f) SPT was performed 6 days after a single dose (F3,34=9.974, P<0.001). (g, h) TST (F3,32=12.019, P<0.001) and FST (F3,32=14.479, P<0.001) were performed 7 days after a single dose. Data are shown as mean±s.e.m. (n=8–11). *P<0.05, and ***P<0.001. (i) The schedule of learned helplessness (LH) model and behavioral tests after treatment. (j, k) The failure of LH (one-way ANOVA, F2,15=3.903, P=0.043) and the escape latency of LH (F2,15=4.317, P=0.033) were measured 5 days after a single dose of saline, R-ketamine (20 mg kg−1) or S-ketamine (20 mg kg−1). Data are shown as mean±s.e.m. (n=6). *P<0.05. ANOVA, analysis of variance; FST, forced swimming test; IES, inescapable electric foot shock; LH, learned helplessness; LMT, locomotion test; NS, not significant; PS, post-shock test; SPT, sucrose preference test; TST, tail suspension test.
Figure 2
Figure 2
Effects of R-ketamine and S-ketamine on alterations in dendritic spine density in the brain regions after social defeat stress. Brain samples were collected 8 days after a single dose of saline, R-ketamine (10 mg kg−1) or S-ketamine (10 mg kg−1) for Golgi–Cox staining. Representative photomicrographs of Golgi–Cox-stained pyramidal neurons in the PrL of mPFC, IL of mPFC, NAc core, NAc shell, striatum, CA1, CA3 and DG of hippocampus from animals of each group. Scale bar=10 μm. (a) PrL (one-way analysis of variance, F3,20=8.123, P=0.001); (b) IL (F3,20=0.528, P=0.668); (c) NAc core (F3,20=6.318, P=0.003); (d) NAc shell (F3,20=6.332, P=0.003); (e) striatum (F3,20=0.381, P=0.768); (f) CA1 (F3,20=0.459, P=0.714); (g) CA3 (F3,20=8.448, P=0.001); (h) DG (F3,20=5.546, P=0.006). Values represent the mean±s.e.m. (n=6). *P<0.05, **P<0.01, ***P<0.001. DG, dentate gyrus; IL, infralimbic region; mPFC, medial prefrontal cortex; NAc, nucleus accumbens; N.S., not significant; PrL, prelimbic region.
Figure 3
Figure 3
Role of AMPA receptor and BDNF–TrkB signaling in the mechanisms of antidepressant effect for R-ketamine and S-ketamine. (a) The schedule of social defeat stress model and behavioral tests after treatment. NBQX (10 mg kg−1), an AMPA receptor antagonist, was administered 30 min before saline, R-ketamine (10 mg kg−1) or S-ketamine (10 mg kg−1). Behavioral tests, including (b) LMT (one-way ANOVA, F5,34=0.06, P=0.997), (c) TST (F5,39=14.628, P<0.001) and (d) FST (F5,42=9.015, P<0.001), were performed 1 day after a single dose. (e) SPT was 7 days after a single dose of saline, R-ketamine (10 mg kg−1) or S-ketamine (10 mg kg−1) (F5,40=11.748, P<0.001). Values represent the mean±s.e.m. (n=6–9). *P<0.05, **P<0.01 and ***P<0.001. (f) The schedule of social defeat stress model and behavioral tests after treatment. ANA-12 (0.5 mg kg−1), a TrkB antagonist, was co-administered with saline or R-ketamine (10 mg kg−1) or S-ketamine (10 mg kg−1). Behavioral tests, including (g) LMT (one-way ANOVA, F5,37=0.414, P=0.836), (h) TST (F5,33=14.044, P<0.001) and (i) FST (F5,32=15.783, P<0.001), were performed 1 day after a single dose. (j) The SPT was 7 days after a single dose of saline, R-ketamine or S-ketamine (F5,36=11.825, P<0.001). Values represent the mean±s.e.m. (n=6–8). *P<0.05, **P<0.01 and ***P<0.001. AMPA, α-amino-3-hydroxy-5-methyl-4-isoxazolepropionic acid receptor; ANOVA, analysis of variance; BDNF, brain-derived neurotrophic factor; FST, forced swimming test; LMT, locomotion test; N.S., not significant; SPT, sucrose preference test; TST, tail suspension test.
Figure 4
Figure 4
Effect for R-ketamine and S-ketamine on the BDNF, TrkB phosphorylation and GluA1 in the brain regions. Brain samples were collected 7 days after a single dose of saline, R-ketamine (10 mg kg−1) or S-ketamine (10 mg kg−1) for Golgi–Cox staining. (a) Western blot analysis of BDNF in PFC, NAc, CA1, CA3 and DG. PFC (one-way ANOVA, F3,13=5.759, P=0.009); NAc (F3,13=3.544, P=0.045); CA1 (F3,14=0.065, P=0.978); CA3 (F3,13=8.324, P=0.002); DG (F3,13=7.444, P=0.003). The value was expressed as a percentage of that of control mice. Values represent the mean±s.e.m. (n=5 or 6). *P<0.05, **P<0.01, ***P<0.001. (b, c) Effects of R-ketamine and S-ketamine on changes in phosphorylation of TrkB in the mouse brain after social defeat stress. The ratio of p-TrkB to total TrkB in the brain regions was shown. PFC (one-way ANOVA, F3,13=3.962, P=0.033); NAc (F3,13=3.613, P=0.043); CA1 (F3,14=0.05, P=0.984); CA3 (F3,14=6.545, P=0.005); DG (F3,13=7.612, P=0.003). Total levels of TrkB protein in the all regions were not different among the four groups. Values represent the mean±s.e.m. (n=5 or 6). *P<0.05, **P<0.01. (d) Western blot analysis of GluA1 in PFC, NAc, CA1, CA3 and DG of the hippocampus. PFC (one-way ANOVA, F3,13=3.619, P=0.04); NAc (F3,14=7.834, P=0.003); CA1 (F3,14=0.060, P=0.98); CA3 (F3,14=5.207, P=0.013); DG (F3,14=5.108, P=0.014). The value was expressed as a percentage of that of control mice. Values represent the mean±s.e.m. (n=5 or 6). *P<0.05, **P<0.01, ***P<0.001. ANOVA, analysis of variance; BDNF, brain-derived neurotrophic factor; DG, dentate gyrus; NAc, nucleus accumbens; N.S., not significant; PFC, prefrontal cortex.
Figure 5
Figure 5
Side-effect profiles for S-ketamine, but not R-ketamine, in mice. (a) Effects of R-ketamine and S-ketamine on locomotion in control mice. One hour after habituation, saline, R-ketamine (5, 10 or 20 mg kg−1) or S-ketamine (5, 10 or 20 mg kg−1) was administered intraperitoneally into mice. Two-way ANOVA analysis revealed significant interactions (drug: F6,125=6.441, P<0.001; time: F17,125=138.838, P<0.001; interaction (drug × time): F102,1125=2.814, P<0.001). Values represent the mean±s.e.m. (n=8). **P<0.01, ***P<0.001 compared with the saline-treated group. (b) Effects of R-ketamine (5, 10 or 20 mg kg−1) on PPI test in control mice. The MANOVA revealed no significant effect (Wilks' lambda=0.713, P=0.333). Values represent the mean±s.e.m. (n=8). (c) Effects of S-ketamine (5, 10 or 20 mg kg−1) on the PPI test in control mice. The MANOVA revealed significant effect (Wilks' lambda=0.554, P=0.019). Values represent the mean±s.e.m. (n=8). *P<0.05, **P<0.01 compared with the saline-treated group. (d) The schedule of CPP model and behavioral tests after treatment. (e) RS-ketamine (10 mg kg−1) significantly (P=0.0125) increased CPP scores in mice (n=9). *P<0.05 compared with the saline-treated group. (f) R-ketamine (5, 10 or 20 mg kg−1) did not increase CPP score (F3,35=0.147, P=0.931). (g) S-Ketamine (5, 10 or 20 mg kg−1) significantly increased CPP score (F3,34=5.441, P=0.004). Values represent the mean±s.e.m. (n=9–10). *P<0.05, **P<0.01 compared with the saline-treated group. ANOVA, analysis of variance; CPP, conditioned place preference test; MANOVA, multivariate analysis of variance; PPI, prepulse inhibition.
Figure 6
Figure 6
Effect of R-ketamine and S-ketamine on PV-positive immunostaining in the brain. Mice were perfused 30 min after a single dose of saline, R-ketamine (10 mg kg−1) or S-ketamine (10 mg kg−1). Then PV immunohistochemistry was performed. Representative photomicrographs of PV immunohistochemistry in the PrL (a) and IL (b) of mPFC, NAc (c), CA1 (d), CA3 (e) and DG (f) of hippocampus from animals of each group. Scale bar=10 μm (ac) or 200 μm (df). One-way analysis of variance revealed significant effects in the PrL (F2,14=7.57, P=0.016) of mPFC and DG (F2,15=13.834, P<0.001), but not IL of mPFC (F2,14=0.602, P=0.562), NAc (F2,15=0.019, P=0.981), CA3 (F2,15=0.015, P=0.985) and CA1 (F2,14=0.234, P=0.795). The data show the mean±s.e.m. (n=5 or 6). *P<0.05, ***P<0.001 compared with the saline-treated group. DG, dentate gyrus; IL, infralimbic region; mPFC, medial prefrontal cortex; NAc, nucleus accumbens; N.S., not significant; PrL, prelimbic region; PV, parvalbumin.

References

    1. World Health Organization (WHO) Depression. Fact sheet No. 369 2012. Available at http://www.who.int/mediacentre/factsheets/fs369/en/index.html; last accessed on 28 July, 2015.
    1. Hashimoto K. Inflammatory biomarkers as differential predictors of antidepressant response. Int J Mol Sci 2015; 16: 7796–7801. - PMC - PubMed
    1. Monteggia LM, Zarate C Jr. Antidepressant actions of ketamine: from molecular mechanisms to clinical practice. Curr Opin Neurobiol 2015; 30: 139–143. - PMC - PubMed
    1. Krystal JH, D'Souza DC, Petrakis IL, Belger A, Berman RM, Charney DS et al. NMDA agonists and antagonists as probes of glutamatergic dysfunction and pharmacotherapies in neuropsychiatric disorders. Harv Rev Psychiatry 1999; 7: 125–143. - PubMed
    1. Hashimoto K. Emerging role of glutamate in the pathophysiology of major depressive disorder. Brain Res Rev 2009; 61: 105–123. - PubMed

Publication types