Comparative Study
. 2015 Aug;138(2):833-45.
doi: 10.1121/1.4926563.

Effect of body position on vocal tract acoustics: Acoustic pharyngometry and vowel formants

Affiliations
Comparative Study

Effect of body position on vocal tract acoustics: Acoustic pharyngometry and vowel formants

Houri K Vorperian et al. J Acoust Soc Am. 2015 Aug.

Abstract

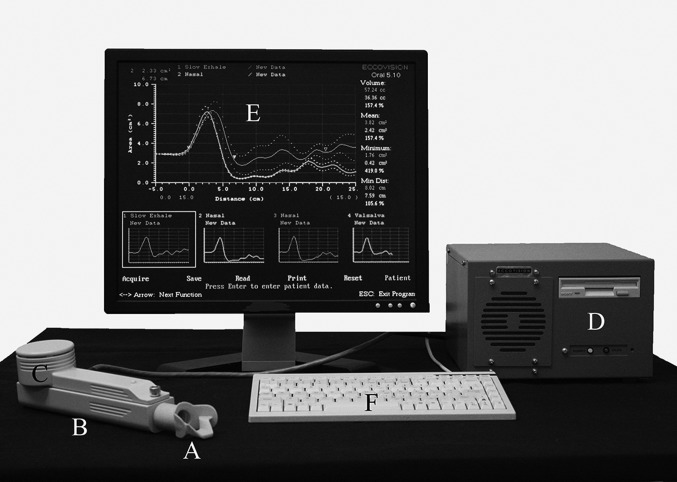
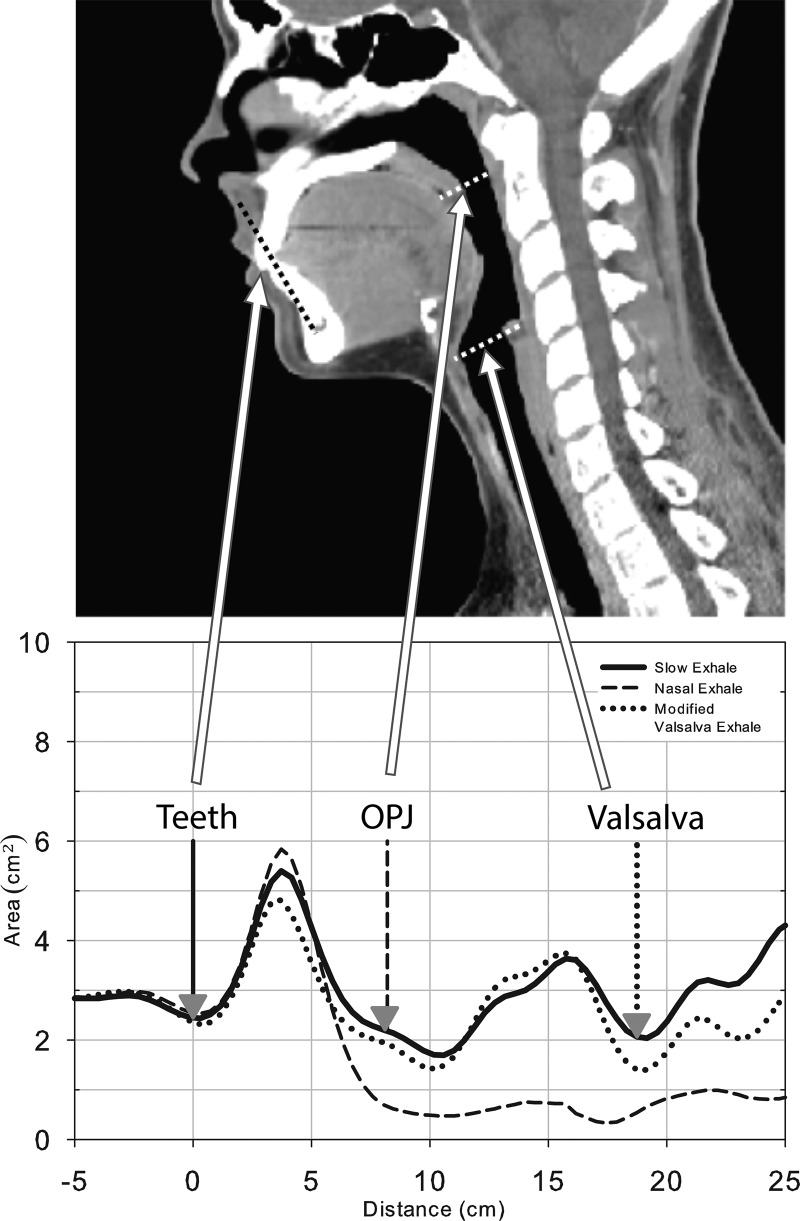
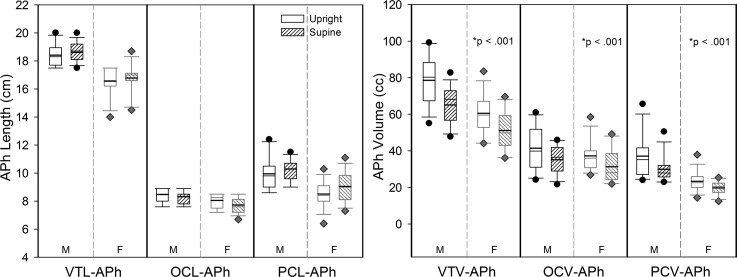
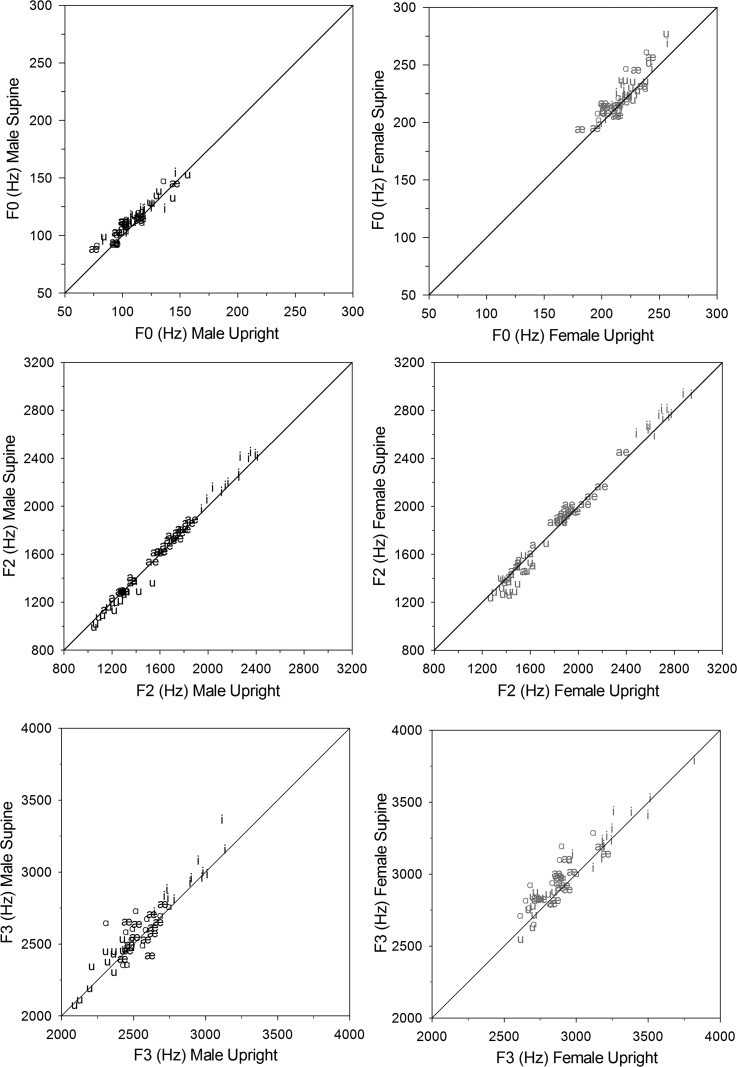
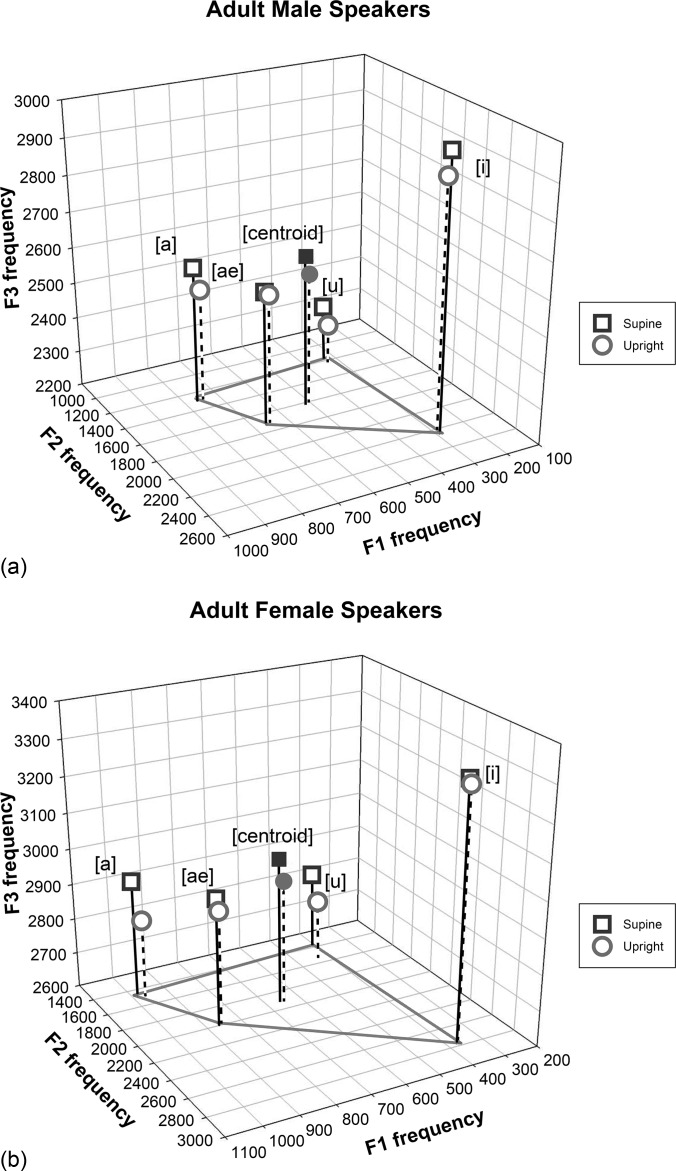
The anatomic basis and articulatory features of speech production are often studied with imaging studies that are typically acquired in the supine body position. It is important to determine if changes in body orientation to the gravitational field alter vocal tract dimensions and speech acoustics. The purpose of this study was to assess the effect of body position (upright versus supine) on (1) oral and pharyngeal measurements derived from acoustic pharyngometry and (2) acoustic measurements of fundamental frequency (F0) and the first four formant frequencies (F1-F4) for the quadrilateral point vowels. Data were obtained for 27 male and female participants, aged 17 to 35 yrs. Acoustic pharyngometry showed a statistically significant effect of body position on volumetric measurements, with smaller values in the supine than upright position, but no changes in length measurements. Acoustic analyses of vowels showed significantly larger values in the supine than upright position for the variables of F0, F3, and the Euclidean distance from the centroid to each corner vowel in the F1-F2-F3 space. Changes in body position affected measurements of vocal tract volume but not length. Body position also affected the aforementioned acoustic variables, but the main vowel formants were preserved.


Figures

FIG. 1.
FIG. 1.
The APh system consisting of the mouthpiece (A), wave tube (B), electronic platform (C), control unit/microcomputer (D), monitor (E), and keyboard controls (F). The top half of the monitor display shows a slow exhale condition pharyngogram superimposed with a nose exhale condition pharyngogram. The bottom half of the monitor shows the four different pharyngograms per participant that the system can hold so that each can be superimposed on any of the other pharyngograms to determine consistency of the same exhale condition, or to locate landmarks as described in Fig. 2.
FIG. 2.
FIG. 2.
A visual representation of the anatomic measures on a pharyngogram (bottom) with corresponding anatomic landmarks on a midsagittal CT scan (top). The CT is for illustrative purposes and representative of normal breathing, not any of the APh breathing conditions. The bottom display is a schematic of three pharyngograms displaying the three different breathing conditions superimposed to illustrate how the nasal and modified valsalva pharyngograms are, respectively, used to locate the OPJ and the glottis on the slow exhale pharyngogram.
FIG. 3.
FIG. 3.
Box plots of APh data for length (left figure) and volume (right figure) for the VT, OC, and PC in males (M) and females (F) in the upright (no fill) and supine (hashed) body positions. The upper and lower bounds of the box are the 75th and 25th percentiles, respectively. The solid black line represents the mean, and the solid gray line represents the median. The upper and lower whiskers represent the 90th and 10th percentiles, respectively, with the black dots and gray diamonds representing outlying data for males and females, respectively. Asterisk denotes significance for body position.
FIG. 4.
FIG. 4.
Scatterplots of the acoustic variables with significant effects for body position: F0 main effect (top panel), F3 main effect (lower panel), and F2 interaction effect (middle panel. The diagonal solid lines (y = x) indicate the reference of perfect consistency between the two body positions.
FIG. 5.
FIG. 5.
3D display of the vowel quadrilateral using the first three formants, as well as the 3D Euclidean distance from the centroid to each of the corner vowels in the F1-F2-F3 vowel acoustic space for male speakers (top) and female speakers (bottom).

Similar articles

Cited by

References

    1. Alwan, A. , Narayanan, S. , and Haker, K. (1997). “ Toward articulatory-acoustic models for liquid approximants based in MRI and EPG data. Part II. The rhotics,” J. Acoust. Soc. Am. 101, 1078–1089.10.1121/1.417972 - DOI - PubMed
    1. Bae, Y. , Perry, J. L. , and Kuehn, D. P. (2014). “ Videofluoroscopic investigation of body position on articulatory positioning,” J. Speech, Lang., Hear. Res. 57, 1135–1147.10.1044/2013_JSLHR-S-12-0235 - DOI - PubMed
    1. Brown, I. B. , McClean, P. A. , Boucher, R. , Zamel, N. , and Hoffstein, V. (1987). “ Changes in pharyngeal cross-sectional area with posture and application of continuous positive airway pressure in patients with obstructive sleep apnea,” Am. Rev. Respir. Dis. 136, 628–632.10.1164/ajrccm/136.3.628 - DOI - PubMed
    1. Buchaillard, S. , Perrier, P. , and Payan, Y. (2009). “ A biomechanical model of cardinal vowel production: Muscle activations and the impact of gravity on tongue positioning,” J. Acoust. Soc. Am. 126, 2033–2051.10.1121/1.3204306 - DOI - PubMed
    1. Burris, C. , Vorperian, H. K. , Fourakis, M. , Kent, R. D. , and Bolt, D. M. (2014). “ Quantitative and descriptive comparison of four acoustic analysis systems: Vowel measurements,” J. Speech, Lang., Hear. Res. 57, 26–45.10.1044/1092-4388(2013/12-0103) - DOI - PMC - PubMed

Publication types