. 2015 Aug;138(2):1090-101.
doi: 10.1121/1.4915001.

Effective biosonar echo-to-clutter rejection ratio in a complex dynamic scene

Affiliations

Effective biosonar echo-to-clutter rejection ratio in a complex dynamic scene

Jeffrey M Knowles et al. J Acoust Soc Am. 2015 Aug.

Abstract

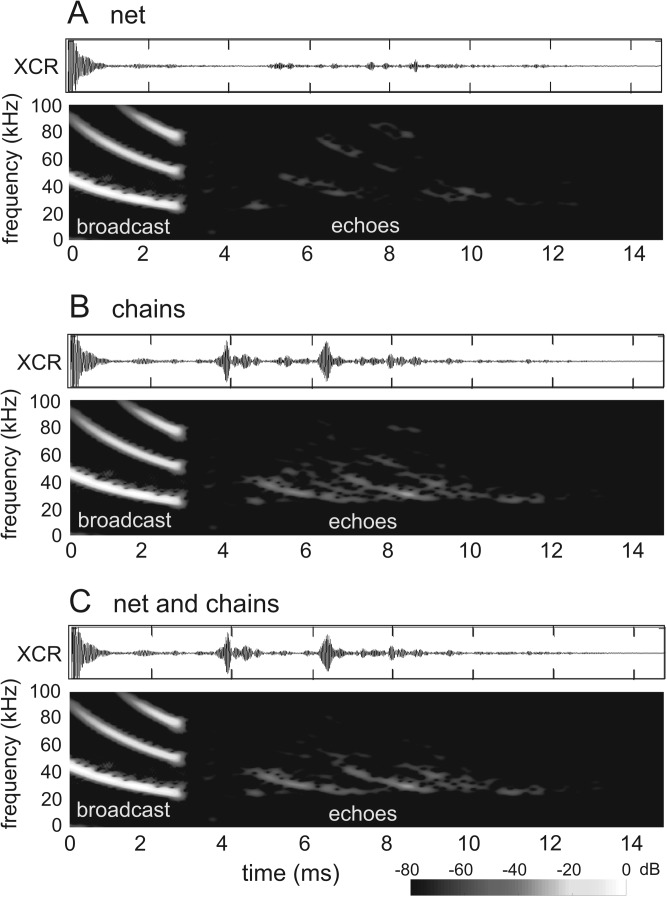
Biosonar guidance in a rapidly changing complex scene was examined by flying big brown bats (Eptesicus fuscus) through a Y-shaped maze composed of rows of strongly reflective vertical plastic chains that presented the bat with left and right corridors for passage. Corridors were 80-100 cm wide and 2-4 m long. Using the two-choice Y-shaped paradigm to compensate for left-right bias and spatial memory, a moveable, weakly reflective thin-net barrier randomly blocked the left or right corridor, interspersed with no-barrier trials. Flight path and beam aim were tracked using an array of 24 microphones surrounding the flight room. Each bat flew on a path centered in the entry corridor (base of Y) and then turned into the left or right passage, to land on the far wall or to turn abruptly, reacting to avoid a collision. Broadcasts were broadly beamed in the direction of flight, smoothly leading into an upcoming turn. Duration of broadcasts decreased slowly from 3 to 2 ms during flights to track the chains' progressively closer ranges. Broadcast features and flight velocity changed abruptly about 1 m from the barrier, indicating that echoes from the net were perceived even though they were 18-35 dB weaker than overlapping echoes from surrounding chains.


Figures

FIG. 1.
FIG. 1.
Rationale for experiments. Bat is released into a darkened Y-shaped flight maze formed by rows of vertical plastic chains that strongly reflect the bat's incident sonar sounds (Barchi et al., 2013). The center corridor diverges into two corridors, left and right, one of which is blocked on randomly selected trials by a thin net that reflects weaker echoes than the chains. The corridors are long enough that the net is not detected until the bat already has chosen the left or right passage, so that its reaction to the net (at **) depends on the strength of the net's echoes relative to the chains' echoes, not on knowing the net's position before entering the corridor.
FIG. 2.
FIG. 2.
Diagrams showing experimental procedure for flight tests and polar coordinates for plotting broadcast beam axis. (A) Plan view of flight chamber (black walls). Small black circles mark locations of vertical chains that form Y-shaped maze with corridors on left and right for the narrow chain array condition. Moveable net barrier (horizontal dashed line; randomly appearing at right, center, left positions on average every three trials or every 10 trials), 24-microphone array for acoustic tracking of the bat in flight (gray squares; four of the microphones are occluded by being at same position as other microphones on the plan), two infrared thermal-imaging video cameras for monitoring each flight, and a sample flight path tracked by the microphone array (curving line of gray dots). Black curving arrow shows segment where bat is engaged with left–right choice end flying in corridor. (B) Plan view for wide chain array showing individual chains that were removed from narrow array in A (open circles) to increase corridor width without sacrificing essential Y-shaped path for bat. (C) Plan view for narrow chain array showing individual chains added to wide array (gray circles; shown as open circles in B) to restrict corridor width and enclose Y-shaped paths. Note single row of chains at 6.2 m position on length axis with center gap for bat to fly into working area of the microphone array. Each sonar sound is localized acoustically to a particular position on the flight path, with a vector on polar-plot insert indicating the orientation of the acoustic axis of the broadcast beam relative to the instantaneous flight-path vector. Beam-axis vectors ultimately are plotted on a compound polar plot (in B, C) that combines left and right corridor flights to indicate beam direction to center of room or to outside, instead of just to the bat's left or right.
FIG. 3.
FIG. 3.
Echoes from the net barrier and the chain maze at 1 m range. Pairs of panels show cross-correlation function (XCR) for broadcast and stream of echoes on top with spectrograms for (A) net barrier alone, (B) chains alone, and (C) net with chains on bottom. Broadcast is synthesized 3-harmonic FM sound; all waveforms averaged with 50 presentations to improve signal-to-noise ratio. The net returns multiple, relatively weak reflections; the chains return multiple, strong reflections. The XCR series is lower for the net than for the chain echoes at all delays. Spectrogram density scale at bottom displays decibels of attenuation compared to reference echo from a Plexiglas reflector at 1 meter from the emitter/microphone.
FIG. 4.
FIG. 4.
Tracks for three representative flights in narrow chain array showing broadcast beam axis relative to flight path. (Localized positions are circles, acoustic axes are arrows) (A) Moveable net barrier in center. (B) Net barrier on right. (C) Net barrier on left. During each flight, the bat moves smoothly along its course and aims its sound beam in the direction of flight, with a tendency to “lead” into the turn as it flies along the chosen corridor. Wide alternating scanning movements to the left and right do not occur. The gray shaded sector in C shows the approximate reaction zone where the presence of obstacles induces specific responses compared to the ongoing behavior associated just with the corridor.
FIG. 5.
FIG. 5.
Left–right side preferences for each bat over all flights in Series 1, 2, and 3. Series 1 was conducted in the wide array between 2/8/2010 and 3/24/2010. Series 2 was conducted in the narrow array between 4/9/2010 and 6/10/2010. Series 3 was conducted in the narrow array between 9/2/2010 and 9/17/2010. Each of the three bats developed a strong preference for the corridor on one side or the other and generally maintained this preference throughout the course of the experiments.
FIG. 6.
FIG. 6.
Two-dimensional occupancy histograms (plan view, top) for flight paths and mean flight-speed measurements (bottom) for all bats' flights through the chain maze in three experimental conditions. (A) All flights from Series 1 superimposed, with wide chain array [as in Fig. 1(B)] and random changes in net barrier [Fig. 1(A)] every 3 trials on average. (B) All flights from Series 2, with narrow chain array [as in Fig. 1(C)] and random changes in net barrier every 3 trials on average. (C) All flights from Series 3, with narrow chain array [as in Fig. 1(C)] and random changes in net barrier every 10 trials on average. To make occupancy histograms, 1 for each flight, the bat's X and Y positions [i.e., width vs length in Fig. 2(A)] were calculated at 20 ms intervals, and the resulting X-Y data were placed into 0.0025 m2 position bins on the plan view of the flight chamber before combining across all flights and all bats. Occupancy histogram plots on left show flights with bat's choice of the left or right corridor the same as the position of the net barrier; plots on right show the bat's choice on opposite side. Note that flights on same side as net barrier end with landing on the barrier. The width of the occupancy histogram is wider in the wide chain array (Series 1, A) compared to the narrow chain array (Series 2, B and Series 3, C). Graphs at bottom show average flight speed versus distance to the barrier's location. On each flight, the bat's speed was determined for sequential positions in 0.2 m bins. The mean flight speed in each bin was then calculated for all flights in Control (C; barrier in center), Same (S; barrier on same side of bat's left–right choice), and Opposite (O; barrier on opposite side of bat's left–right choice). Error bars denote standard error around the mean flight speed.
FIG. 7.
FIG. 7.
Acoustic behavior during flight to the net barrier. Graphs plot the mean pulse repetition rate (PRR), highest frequency in 1st-harmonic sweep (Fmax), lowest frequency in 1st-harmonic sweep (Fmin), duration (Dur) and percent calls in strobe groups (% SG) (see Sec. II) for each 0.2 m distance bin relative to the net. Individual curves show data from Control, Same, and Opposite flights in Series 1 (A), Series 2 (B), and Series 3 (C). Error bars denote standard error about the mean. In Series 1 (wide array) and Series 2 (narrow array), values in the Same condition diverge from values in the Opposite and the Control conditions slightly less than 1 m before the bat reaches the net's position. In Series 3 (narrow array), these parameters diverge earlier in the flight, about 1.0–2.0 m before the net's position. (See statistics in Fig. 8.)
FIG. 8.
FIG. 8.
Statistical comparisons for behavior between flight conditions. Graphs show probability of difference between Same and Opposite conditions occurring by chance for flight velocity (black lines) and five acoustic parameters of broadcasts (in legend) at different distances from the net barrier. For each experimental condition (Series 1, 2, 3), the null hypothesis that the series of values at 0.2 m distance bins for each parameter of the Same flights was drawn from a population identical to that of the opposite flights. At each distance from the barrier (x axis), the α value for rejecting the null hypothesis is plotted on a log scale (y axis). Two statistical tests were performed—a rank sum test (plotted here) and a two-sample t-test (see Results), which produced nearly identical results. The horizontal dotted line denotes the threshold value for rejecting the null hypothesis after adjusting for the multiple comparisons for the data depicted in Figs. 6 and 7 (six measured parameters at 24 spatial distance bins = 144 paired comparisons). These tests confirm the view from Figs. 6 and 7 that the distance of reaction to the net is only slightly less than 1 m from the net for Series 1 and Series 2, but 1–2 m from the net for Series 3.
FIG. 9.
FIG. 9.
Mean direction of acoustic axis for broadcast beams of all bats at different locations in flight. (A) Flights in wide array with barrier moved approximately every three trials (Series 1). (B) Flights in narrow array with barrier moved approximately every three trials (Series 2). (C) Flights in narrow array with barrier moved approximately every 10 trials (Series 3). [See Figs. 2(B) and 2(C) for explanation of polar coordinates collapsed over left and right sides and four regions of the chain array; see Fig. 4 for example flights.] Vectors are combined for sounds emitted in each of the four regions of chain array. In all three experimental conditions, when entering the array (Region 1) and flying prior to the Y-shaped left–right separation (Region 2), the bats aim their sounds straight ahead relative to the flight direction. After entering the left or right corridor (Region 3), and passing through the most restricted space (Region 4), the bats aim their sounds toward the center of the room relative to the direction of flight, “leading” in the direction of the upcoming turn.

Similar articles

Cited by

References

    1. Bandyopadhyay, P. R. , Leinhos, H. A. , and Hellum, A. N. (2013). “ Handedness helps homing in swimming and flying animals,” Sci. Rep. 3, 1128–1137. - PMC - PubMed
    1. Barchi, J. R. , Knowles, J. M. , and Simmons, J. A. (2013). “ Spatial memory and stereotypy of flight paths by big brown bats in cluttered surroundings,” J. Exp. Biol. 216, 1053–1063.10.1242/jeb.073197 - DOI - PubMed
    1. Falk, B. , Jakobsen, L. , Surlykke, A. , and Moss, C. F. (2014). “ Bats coordinate sonar and flight behavior as they forage in open and cluttered environments,” J. Exp. Biol. 217, 4356–4364.10.1242/jeb.114132 - DOI - PMC - PubMed
    1. Ghose, K. , and Moss, C. F. (2003). “ The sonar beam pattern of a flying bat as it tracks tethered insects,” J. Acoust. Soc. Am. 114, 1120–1131.10.1121/1.1589754 - DOI - PMC - PubMed
    1. Gillette, M. D. , and Silverman, H. F. (2008). “ A linear closed-form algorithm for source localization from time-differences of arrival,” IEEE Signal Process. Lett. 15, 1–4.10.1109/LSP.2007.910324 - DOI

Publication types