

Automated quantitative 3D analysis of aorta size, morphology, and mural calcification distributions
- PMID: 26328995
- PMCID: PMC4552704
- DOI: 10.1118/1.4924500
Automated quantitative 3D analysis of aorta size, morphology, and mural calcification distributions
Abstract
Purpose: The purpose of this work is to develop a fully automated pipeline to compute aorta morphology and calcification measures in large cohorts of CT scans that can be used to investigate the potential of these measures as imaging biomarkers of cardiovascular disease.
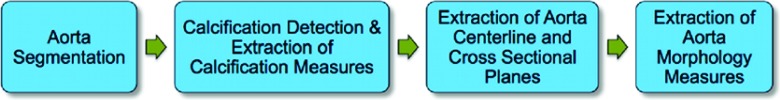
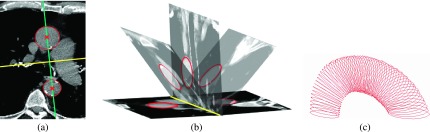
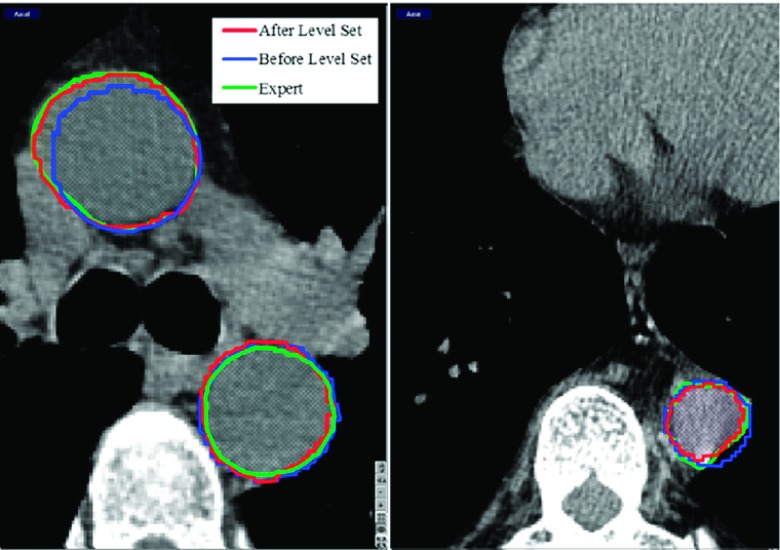
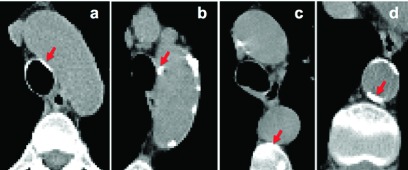
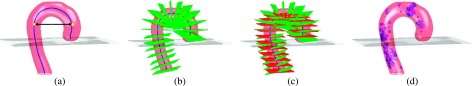
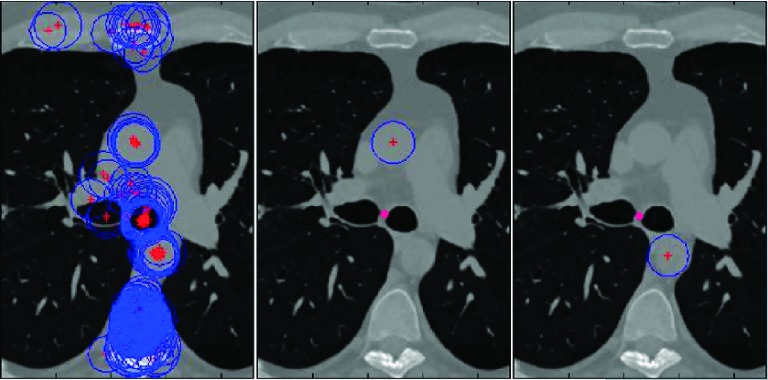
Methods: The first step of the automated pipeline is aorta segmentation. The algorithm the authors propose first detects an initial aorta boundary by exploiting cross-sectional circularity of aorta in axial slices and aortic arch in reformatted oblique slices. This boundary is then refined by a 3D level-set segmentation that evolves the boundary to the location of nearby edges. The authors then detect the aortic calcifications with thresholding and filter out the false positive regions due to nearby high intensity structures based on their anatomical location. The authors extract the centerline and oblique cross sections of the segmented aortas and compute the aorta morphology and calcification measures of the first 2500 subjects from COPDGene study. These measures include volume and number of calcified plaques and measures of vessel morphology such as average cross-sectional area, tortuosity, and arch width.
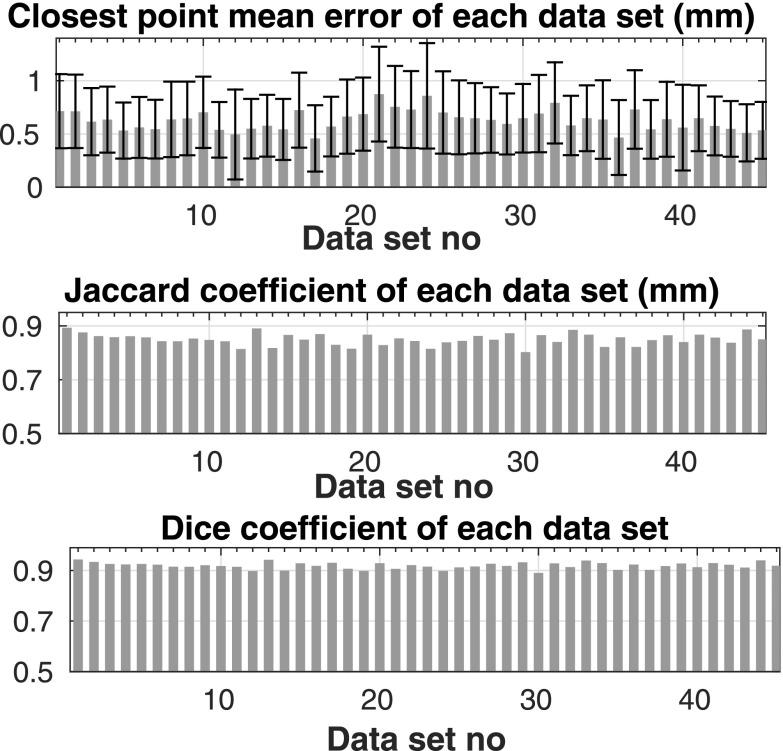
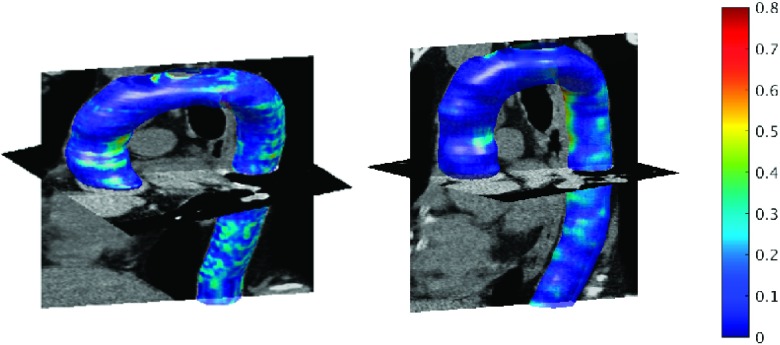
Results: The authors computed the agreement between the algorithm and expert segmentations on 45 CT scans and obtained a closest point mean error of 0.62 ± 0.09 mm and a Dice coefficient of 0.92 ± 0.01. The calcification detection algorithm resulted in an improved true positive detection rate of 0.96 compared to previous work. The measurements of aorta size agreed with the measurements reported in previous work. The initial results showed associations of aorta morphology with calcification and with aging. These results may indicate aorta stiffening and unwrapping with calcification and aging.
Conclusions: The authors have developed an objective tool to assess aorta morphology and aortic calcium plaques on CT scans that may be used to provide information about the presence of cardiovascular disease and its clinical impact in smokers.
Figures

References
-
- Santos R. D., Rumberger J. A., Budoff M. J., Shaw L. J., Orakzai S. H., Berman D., Raggi P., Blumenthal R. S., and Nasir K., “Thoracic aorta calcification detected by electron beam tomography predicts all-cause mortality,” Atherosclerosis 209, 131–135 (2010). 10.1016/j.atherosclerosis.2009.08.025 - DOI - PubMed
Publication types
MeSH terms
Grants and funding
- R01 HL089897/HL/NHLBI NIH HHS/United States
- K23 HL114735/HL/NHLBI NIH HHS/United States
- R01HL089856/HL/NHLBI NIH HHS/United States
- K23HL089353/HL/NHLBI NIH HHS/United States
- R01HL116473/HL/NHLBI NIH HHS/United States
- R01HL116931/HL/NHLBI NIH HHS/United States
- U01 HL089897/HL/NHLBI NIH HHS/United States
- R01 HL116931/HL/NHLBI NIH HHS/United States
- R01 HL089856/HL/NHLBI NIH HHS/United States
- K01 HL118714/HL/NHLBI NIH HHS/United States
- R01 HL116473/HL/NHLBI NIH HHS/United States
- U01 HL089856/HL/NHLBI NIH HHS/United States
- K23HL114735/HL/NHLBI NIH HHS/United States
- K25HL104085/HL/NHLBI NIH HHS/United States
- K23 HL089353/HL/NHLBI NIH HHS/United States
- K25 HL104085/HL/NHLBI NIH HHS/United States
- R01HL089897/HL/NHLBI NIH HHS/United States
LinkOut - more resources
Full Text Sources
Other Literature Sources
