

Local curvature analysis for classifying breast tumors: Preliminary analysis in dedicated breast CT
- PMID: 26328996
- PMCID: PMC4552705
- DOI: 10.1118/1.4928479
Local curvature analysis for classifying breast tumors: Preliminary analysis in dedicated breast CT
Abstract
Purpose: The purpose of this study is to measure the effectiveness of local curvature measures as novel image features for classifying breast tumors.
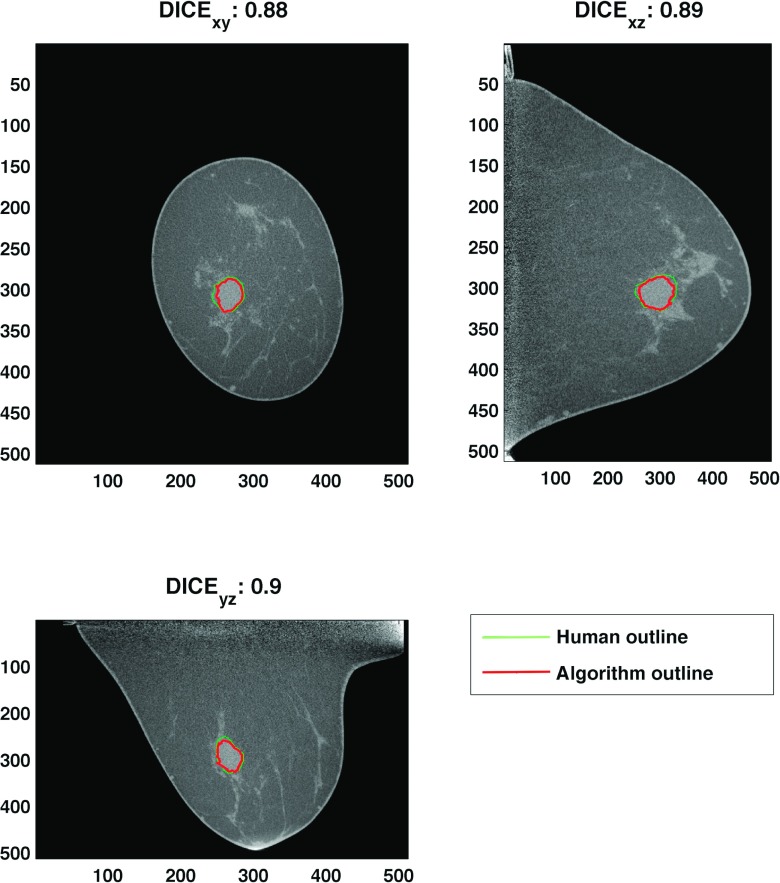
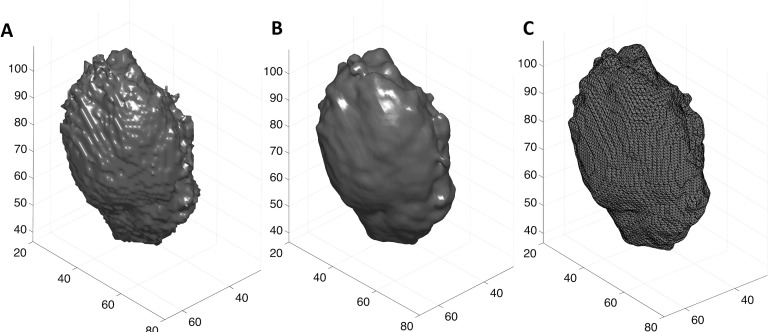
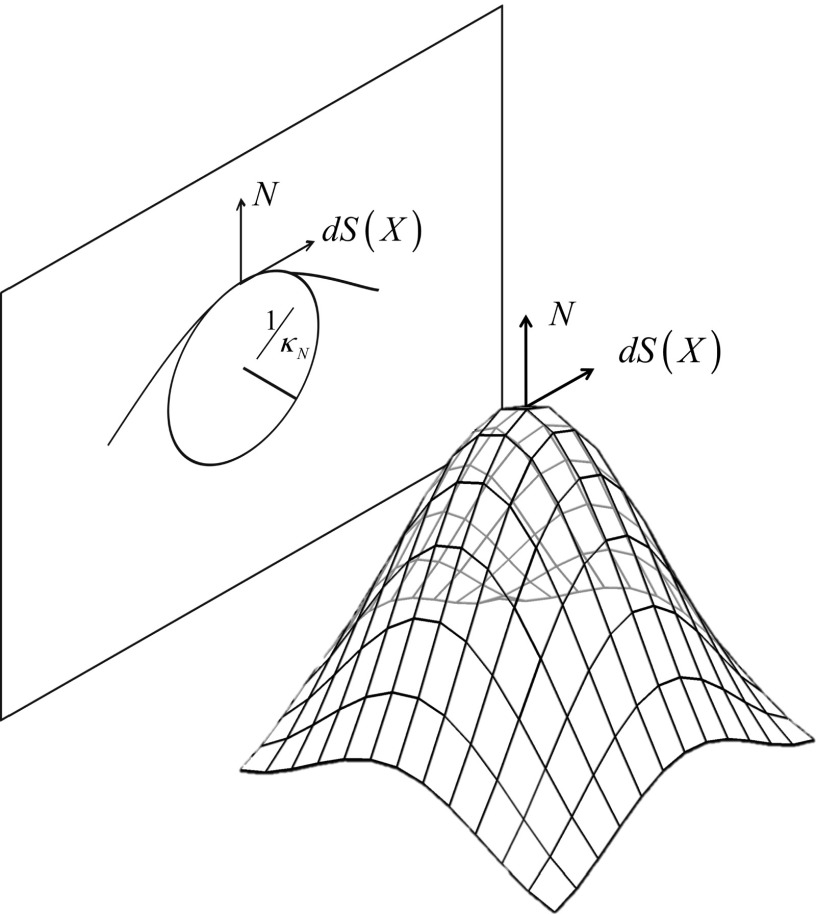
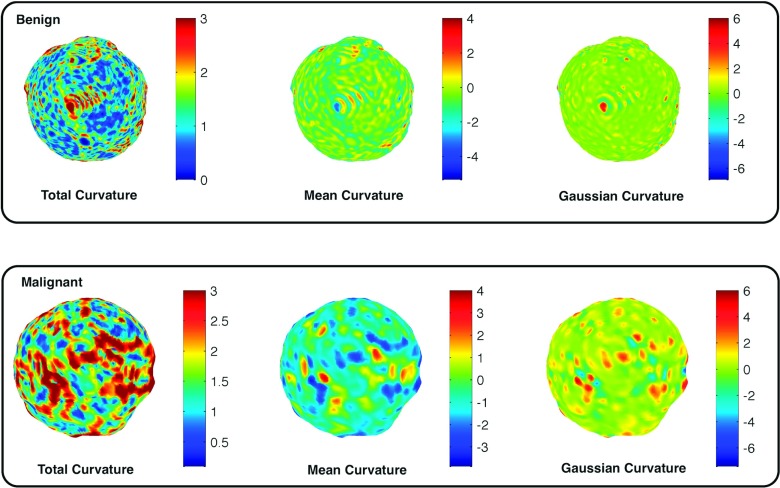
Methods: A total of 119 breast lesions from 104 noncontrast dedicated breast computed tomography images of women were used in this study. Volumetric segmentation was done using a seed-based segmentation algorithm and then a triangulated surface was extracted from the resulting segmentation. Total, mean, and Gaussian curvatures were then computed. Normalized curvatures were used as classification features. In addition, traditional image features were also extracted and a forward feature selection scheme was used to select the optimal feature set. Logistic regression was used as a classifier and leave-one-out cross-validation was utilized to evaluate the classification performances of the features. The area under the receiver operating characteristic curve (AUC, area under curve) was used as a figure of merit.
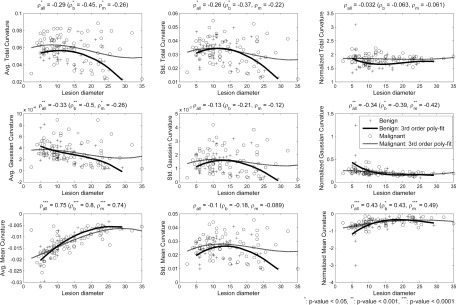
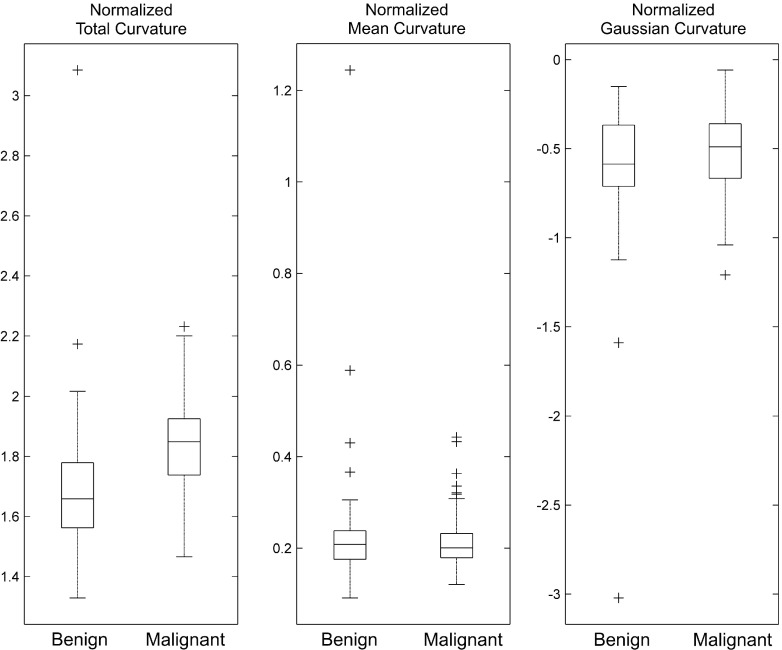
Results: Among curvature measures, the normalized total curvature (CT) showed the best classification performance (AUC of 0.74), while the others showed no classification power individually. Five traditional image features (two shape, two margin, and one texture descriptors) were selected via the feature selection scheme and its resulting classifier achieved an AUC of 0.83. Among those five features, the radial gradient index (RGI), which is a margin descriptor, showed the best classification performance (AUC of 0.73). A classifier combining RGI and CT yielded an AUC of 0.81, which showed similar performance (i.e., no statistically significant difference) to the classifier with the above five traditional image features. Additional comparisons in AUC values between classifiers using different combinations of traditional image features and CT were conducted. The results showed that CT was able to replace the other four image features for the classification task.
Conclusions: The normalized curvature measure contains useful information in classifying breast tumors. Using this, one can reduce the number of features in a classifier, which may result in more robust classifiers for different datasets.
Figures
Similar articles
-
Optimal reconstruction and quantitative image features for computer-aided diagnosis tools for breast CT.Med Phys. 2017 May;44(5):1846-1856. doi: 10.1002/mp.12214. Epub 2017 Apr 13. Med Phys. 2017. PMID: 28295405 Free PMC article.
-
Parenchymal texture analysis in digital mammography: A fully automated pipeline for breast cancer risk assessment.Med Phys. 2015 Jul;42(7):4149-60. doi: 10.1118/1.4921996. Med Phys. 2015. PMID: 26133615 Free PMC article. Clinical Trial.
-
A new and fast image feature selection method for developing an optimal mammographic mass detection scheme.Med Phys. 2014 Aug;41(8):081906. doi: 10.1118/1.4890080. Med Phys. 2014. PMID: 25086537 Free PMC article.
-
Robust phase-based texture descriptor for classification of breast ultrasound images.Biomed Eng Online. 2015 Mar 24;14:26. doi: 10.1186/s12938-015-0022-8. Biomed Eng Online. 2015. PMID: 25889570 Free PMC article.
-
Quantification of elastic heterogeneity using contourlet-based texture analysis in shear-wave elastography for breast tumor classification.Ultrasound Med Biol. 2015 Feb;41(2):588-600. doi: 10.1016/j.ultrasmedbio.2014.09.003. Epub 2014 Nov 25. Ultrasound Med Biol. 2015. PMID: 25444693
Cited by
-
Optimal reconstruction and quantitative image features for computer-aided diagnosis tools for breast CT.Med Phys. 2017 May;44(5):1846-1856. doi: 10.1002/mp.12214. Epub 2017 Apr 13. Med Phys. 2017. PMID: 28295405 Free PMC article.
-
Lack of agreement between radiologists: implications for image-based model observers.J Med Imaging (Bellingham). 2017 Apr;4(2):025502. doi: 10.1117/1.JMI.4.2.025502. Epub 2017 May 3. J Med Imaging (Bellingham). 2017. PMID: 28491908 Free PMC article.
-
Relationship between computer segmentation performance and computer classification performance in breast CT: A simulation study using RGI segmentation and LDA classification.Med Phys. 2018 Jun 19:10.1002/mp.13054. doi: 10.1002/mp.13054. Online ahead of print. Med Phys. 2018. PMID: 29920684 Free PMC article.
-
Neutrosophic segmentation of breast lesions for dedicated breast computed tomography.J Med Imaging (Bellingham). 2018 Jan;5(1):014505. doi: 10.1117/1.JMI.5.1.014505. Epub 2018 Mar 6. J Med Imaging (Bellingham). 2018. PMID: 29541650 Free PMC article.
-
Shape Features of the Lesion Habitat to Differentiate Brain Tumor Progression from Pseudoprogression on Routine Multiparametric MRI: A Multisite Study.AJNR Am J Neuroradiol. 2018 Dec;39(12):2187-2193. doi: 10.3174/ajnr.A5858. Epub 2018 Nov 1. AJNR Am J Neuroradiol. 2018. PMID: 30385468 Free PMC article.
References
Publication types
MeSH terms
Grants and funding
LinkOut - more resources
Full Text Sources
Other Literature Sources
Medical
