. 2015;16 Suppl 11(Suppl 11):S6.
doi: 10.1186/1471-2105-16-S11-S6. Epub 2015 Aug 13.

BactoGeNIE: a large-scale comparative genome visualization for big displays

BactoGeNIE: a large-scale comparative genome visualization for big displays

Jillian Aurisano et al. BMC Bioinformatics. 2015.

Abstract

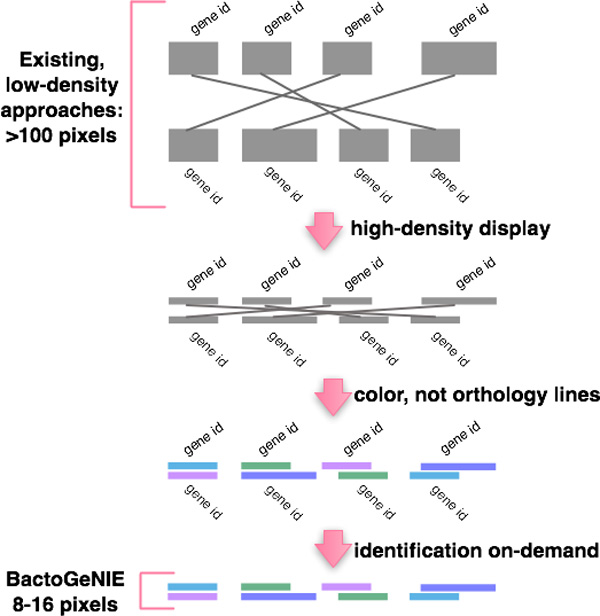
Background: The volume of complete bacterial genome sequence data available to comparative genomics researchers is rapidly increasing. However, visualizations in comparative genomics--which aim to enable analysis tasks across collections of genomes--suffer from visual scalability issues. While large, multi-tiled and high-resolution displays have the potential to address scalability issues, new approaches are needed to take advantage of such environments, in order to enable the effective visual analysis of large genomics datasets.

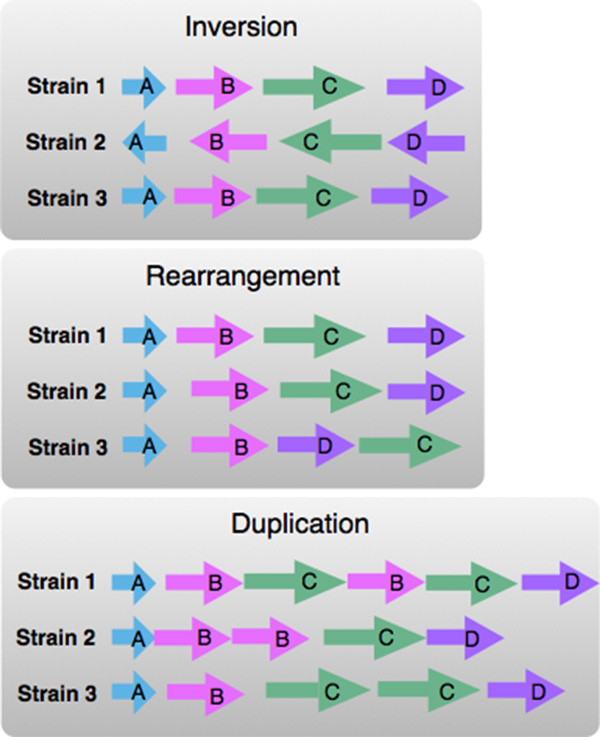
Results: In this paper, we present Bacterial Gene Neighborhood Investigation Environment, or BactoGeNIE, a novel and visually scalable design for comparative gene neighborhood analysis on large display environments. We evaluate BactoGeNIE through a case study on close to 700 draft Escherichia coli genomes, and present lessons learned from our design process.

Conclusions: BactoGeNIE accommodates comparative tasks over substantially larger collections of neighborhoods than existing tools and explicitly addresses visual scalability. Given current trends in data generation, scalable designs of this type may inform visualization design for large-scale comparative research problems in genomics.


Figures

Figure 1
Figure 1
BactoGeNIE enables comparisons across large collections of gene neighborhoods on large, high-resolution environments. The visual encodings and interactions are designed to enable data exploration and browsing to enable users to locate and compare neighborhoods of interest and identify features and outliers in content, order and context within these regions. This image shows the neighborhood around a hypothetical protein in all draft Escherichia coli genomes from the PubMed database.
Figure 2
Figure 2
Content variations: Insertion, deletion and trunction. In this prototype visual encoding, each horizontal line represents a portion of a neighborhood around orthologs, in 3 bacterial strains. Orthologs have the same color and label. The insertion illustration shows a yellow gene in strain 2 whose ortholog is not present in strains 1 and 3. The deletion illustration has gene 'B' missing from strain 2, while it is present in strains 1 and 3. The truncation illustration shows gene B with smaller length in pixels in strain 2, corresponding to a smaller length in nucleotides compared to its orthologs in strains 1 and 3.
Figure 3
Figure 3
Order variations: inversion, rearrangement and duplication. In this prototype visual encoding, each horizontal line represents a portion of a neighborhood around orthologs, in 3 bacterial strains. Orthologs have the same color and label. The inversion illustration shows orthologs in strain 2 with a different orientation, when compared to strains 1 and 3. The rearrangement illustration shows orthologs in strain 2 in a different order, compared to strains 1 and 3. The duplication illustration shows strain 2 with two copies of gene 'B' in strain 2, and two copies of genes 'B' and 'B' in strain 1.
Figure 4
Figure 4
Context variations: gaps and breaks in assembly. In this prototype visual encoding, each horizontal line represents a portion of a neighborhood around orthologs, in 3 bacterial strains. Orthologs have the same color and label. These context variations in neighborhoods indicate potential errors in data generation. The first, shows a gaps in strain 2, highlighted with a pink box, when compared to strains 1 and 3, indicating a potential errors in genome data generation. The second, illustrates breaks in genome assembly, and shows how comparative views may help users resolve such breaks.
Figure 5
Figure 5
This diagram illustrates an iterative adaption of an existing 'low-density' design, to the high-density encoding adopted by BactoGeNIE. At the top, we showed existing 'low-density' orthology-line and text-label encodings. The first transformation, shown by the arrow, reduces the number of pixels for each genome and the gap between genomes, which results in visual clutter. Visual clutter is reduced by replacing lines with color to encode orthology. Finally, by removing text labels BactoGeNIE produces a high-density encoding suitable for large-scale comparative tasks.
Figure 6
Figure 6
This prototype visual encoding shows the view following application of the ortholog-cluster neighborhood targeting function to a neighborhood. Each horizontal line represents a portion of a neighborhood around orthologs, in 3 bacterial strains. Orthologs have the same color. Features and outliers of interest are highlighted in the diagram.
Figure 7
Figure 7
Large Display Scalability. Estimated number of contigs that can fit large displays of varied resolutions for related tools. BactoGeNIE is capable of displaying more gene neighborhoods simultaneously than other approaches, and will scale more effectively to large displays.
Figure 8
Figure 8
673 Strain E.coli Analysis: Applying the ortholog-cluster neighborhood targeting function to close to 700 strains of E.coli produced a view that enabled the identification of features and outliers within the neighborhood of a hypothetical protein, including insertions, inversions and other variations. In addition, breaks in assembly and gaps between genes indicate potential errors in data generation.

References

    1. Wetterstrand KA. DNA Sequencing Costs: Data from the NHGRI Large-Scale Genome Sequencing Program. http://www.genome.gov/sequencingcosts. http://www.genome.gov/sequencingcosts Accessed May 7, 2014.
    1. Overbeek R, Fonstein M, D'souza M, Pusch GD, Maltsev N. The use of gene clusters to infer functional coupling. Proceedings of the National Academy of Sciences. 1999;96(6):2896–2901. doi: 10.1073/pnas.96.6.2896. - DOI - PMC - PubMed
    1. Nielsen CB, Cantor M, Dubchak I, Gordon D, Wang T. Visualizing genomes: techniques and challenges. Nature methods. 2010;7(3 Suppl):S5–S15. - PubMed
    1. McKay S. Plant and Animal Genome XX Conference (January 14-18, 2012) Plant and Animal Genome; 2012. Using the generic synteny browser.
    1. Wang H, Su Y, Mackey AJ, Kraemer ET, Kissinger JC. Synview: a gbrowse-compatible approach to visualizing comparative genome data. Bioinformatics. 2006;22(18):2308–2309. doi: 10.1093/bioinformatics/btl389. - DOI - PubMed

Publication types

Substances

LinkOut - more resources