. 2015 Sep 15;6(27):23930-43.
doi: 10.18632/oncotarget.4525.

E6 and E7 gene silencing results in decreased methylation of tumor suppressor genes and induces phenotype transformation of human cervical carcinoma cell lines

Affiliations

E6 and E7 gene silencing results in decreased methylation of tumor suppressor genes and induces phenotype transformation of human cervical carcinoma cell lines

Liming Li et al. Oncotarget. .

Abstract

In SiHa and CaSki cells, E6 and E7-targeting shRNA specifically and effectively knocked down human papillomavirus (HPV) 16 E6 and E7 at the transcriptional level, reduced the E6 and E7 mRNA levels by more than 80% compared with control cells that expressed a scrambled-sequence shRNA. E6 and E7 repression resulted in down-regulation of DNA methyltransferase mRNA and protein expression, decreased DNA methylation and increased mRNA expression levels of tumor suppressor genes, induced a certain apoptosis and inhibited proliferation in E6 and E7 shRNA-infected SiHa and CaSki cells compared with the uninfected cells. Repression of E6 and E7 oncogenes resulted in restoration of DNA methyltransferase suppressor pathways and induced apoptosis in HPV16-positive cervical carcinoma cell lines. Our findings suggest that the potential carcinogenic mechanism of HPV16 through influencing DNA methylation pathway to activate the development of cervical cancer exist, and maybe as a candidate therapeutic strategy for cervical and other HPV-associated cancers.

Keywords: DNA methylation; HPV16 E6 and E7; cell viability and apoptosis; human cervical carcinoma cell lines; immunoblot.


Conflict of interest statement

CONFLICTS OF INTEREST

Authors declare that they have no conflict of interest.

Figures

Figure 1
Figure 1. Effect of E6 and E7 shRNAs on HPV16 E6 and E7 mRNA expression by RT-PCR
Untreatment (Mock) SiHa cells were transfected with E6-shRNA-1/2/3, E7-shRNA-1/2/3 and control shRNA. After 48 h of incubation, mRNA was extracted and reverse transcripted. cDNA was PCR-amplified with E6 and E7 gene-specific primers and β-actin primers as control.
Figure 2
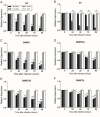
Figure 2. Effect of E6- and E7- shRNAs expression on E6, E7, tumor suppressor genes and DNA methyltransferase genes of SiHa cells
RNA was harvested at 0, 24, 48, 72, 96 hours after lentiviruses infection of SiHa and CaSki (data not shown) cells and subjected to gene expression analysis by Q-PCR normalized to β-actin expression. Each column represents at least 3 repeats. For all genes analyzed, the significant difference of the E6 or E7 shRNA-infected cells (SiHa and CaSki) was compared with the corresponding uninfected cells (Mock) at the each time point. *p < 0.05, **p< 0.001.
Figure 3
Figure 3. Effect of E6- and E7- shRNAs on DNA methylation of tumor suppressor genes by MS-HRM analysis using serial dilutions of methylated DNA (from 100% to 0%) as a template of SiHa cells
Melting curves of SPARC (A), TFPI2 (B), RRAD (C), SFRP1 (D), MT1G (E) and NMES1 (F) genes were showed above. Similar results were obtained for CaSki cells.
Figure 4
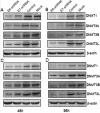
Figure 4. Effect of shRNA-mediated repression of HPV16 E6 and E7 on DNA methyltransferase expression
Immunoblot analysis of DNMT1, DNMT3A, DNMT3B and DNMT3L protein levels in SiHa (A and B) and in CaSki (C and D) were shown above. Protein extracts were made from uninfected (Mock) CaSki and SiHa cells, and from cells infected for 48 and 96 h with lentivirus expressing E6-, E7- and control- shRNA. Extracted protein samples (50μg per lane) were subjected to electrophoresis and immunoblotting with antibodies specific for the 4 protein and β-actin as control for equal loading.
Figure 5
Figure 5. Effect of E6 and E7 repression on CaSki and SiHa cell viability
SiHa (A) and CaSki (B) cells were infected with lentiviruses expressing E6-, E7- and control- shRNA in a 96-well plate. Cell viability was measured with the use of the CCK-8 assay at 9 different time points after infection. The change of cell viability was determined by measuring the mean optical density at 450 nm compared with uninfected (Mock) cells for each cell line. *p < 0.05, **p< 0.001.
Figure 6
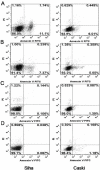
Figure 6. Effect of HPV16 E6 and E7 repression on apoptosis
(A) SiHa and CaSki cells infected with lentiviruses expressing E6-shRNA. (B) SiHa and CaSki cells infected with lentiviruses expressing E7-shRNA. (C) SiHa and CaSki cells infected with lentiviruses expressing control shRNA. (D) Uninfected SiHa and CaSki cells. Cells were assayed by flow cytometry for annexin V binding and PI staining 72 hours after infection. The logarithm of annexin V-fluorescein isothiocyanate fluorescence and the logarithm of PI fluorescence were plotted on the x and y axes of the cytogram. The lower right quadrant shows the percentage of viable cells in the early stages of apoptosis (ie, annexin V-positive, PI-negative cells), the upper right quadrant shows the percentage of cells in a later stage of apoptosis or necrosis (annexin V-positive, PI-positive cells), the lower left shows the percentage of cells in the proliferating-senescence state and the upper left quadrant shows the percentage of dead cells.

Similar articles

Cited by

References

    1. Torre L.A, et al. Global cancer statistics, 2012. CA Cancer J Clin. 2015;65:87–108. - PubMed
    1. Parkin D.M, et al. Global cancer statistics, 2002. CA Cancer J Clin. 2005;55:74–108. - PubMed
    1. Zhou J, et al. Inhibition of cervical cancer cell growth in vitro and in vivo by lentiviral-vector mediated shRNA targeting the common promoter of HPV16 E6 and E7 oncogenes. Antiviral Research. 2013;98:305–313. - PubMed
    1. Rampias T, et al. E6 and E7 Gene Silencing and Transformed Phenotype of Human Papillomavirus 16-Positive Oropharyngeal Cancer Cells. JNCI Journal of the National Cancer Institute. 2009;101:412–423. - PubMed
    1. Zhou J, et al. Transcriptional gene silencing of HPV16 E6/E7 induces growth inhibition via apoptosis in vitro and in vivo. Gynecologic Oncology. 2012;124:296–302. - PubMed

Publication types

MeSH terms

Substances