. 2015;88(1055):20150242.
doi: 10.1259/bjr.20150242. Epub 2015 Sep 2.

Breast density across a regional screening population: effects of age, ethnicity and deprivation

Affiliations

Breast density across a regional screening population: effects of age, ethnicity and deprivation

Samantha L Heller et al. Br J Radiol. 2015.

Abstract

Objective: Breast density (BD) is a recognized risk factor for breast cancer. This study maps density variation across a screening population and identifies demographic distinctions, which may affect density and so impact on cancer development/detection. We focus on the relationship between age, ethnicity and socioeconomic status on density.

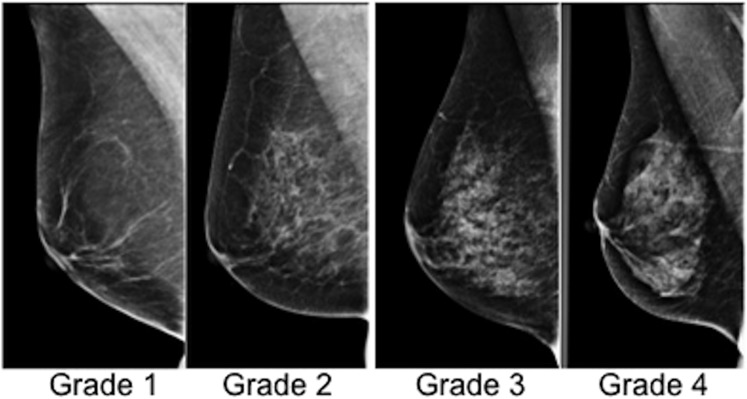
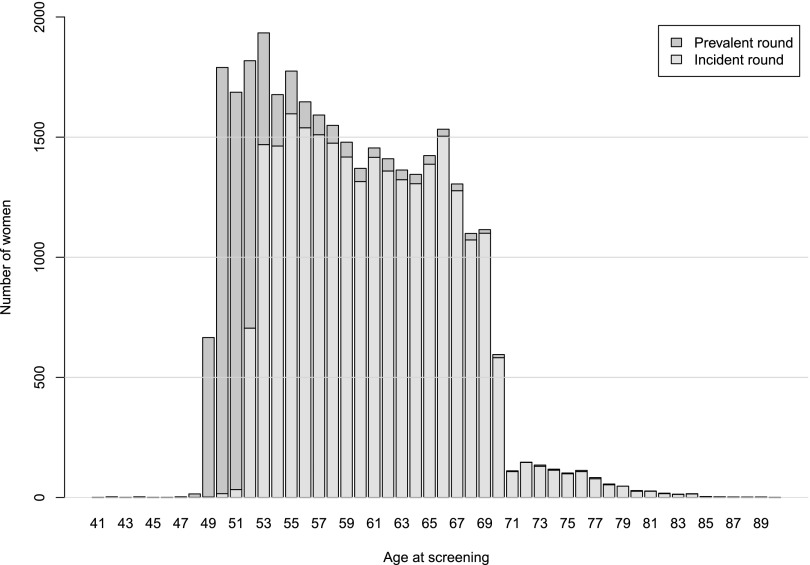
Methods: This retrospective study on a screening population adheres to local patient confidentiality requirements. BD data from screening mammograms (March 2013 to September 2014) were measured using Volpara((®))Density(™) software (Volpara((®))Solutions(™), Wellington, New Zealand). Demographics, including patient age, ethnicity and deprivation index, were obtained from our breast screening database and analysed with respect to breast volume (BV), fibroglandular tissue volume (FGV), Volpara %BD and Volpara Grade (1-4 scale, lowest to highest).

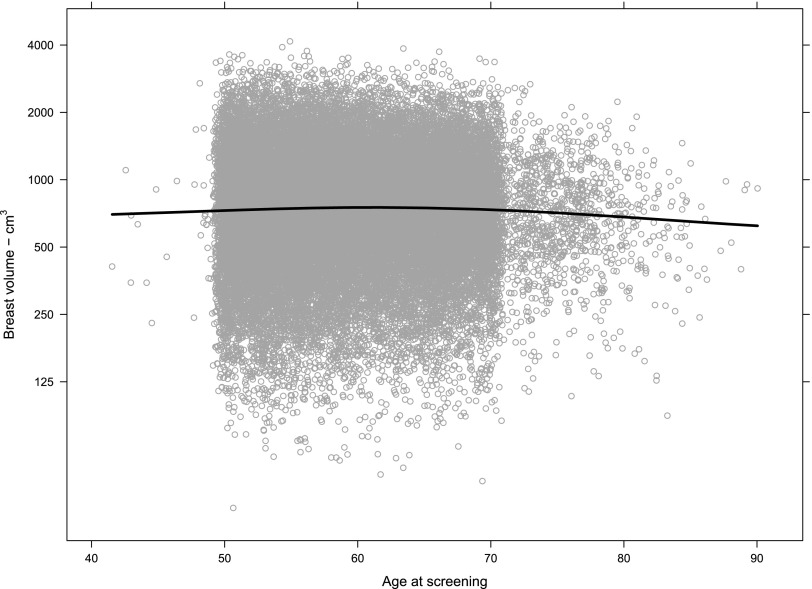
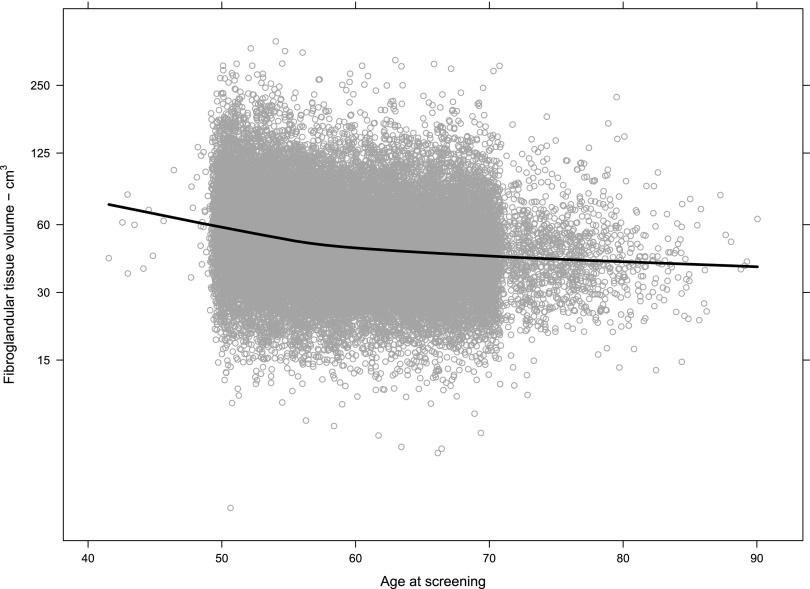
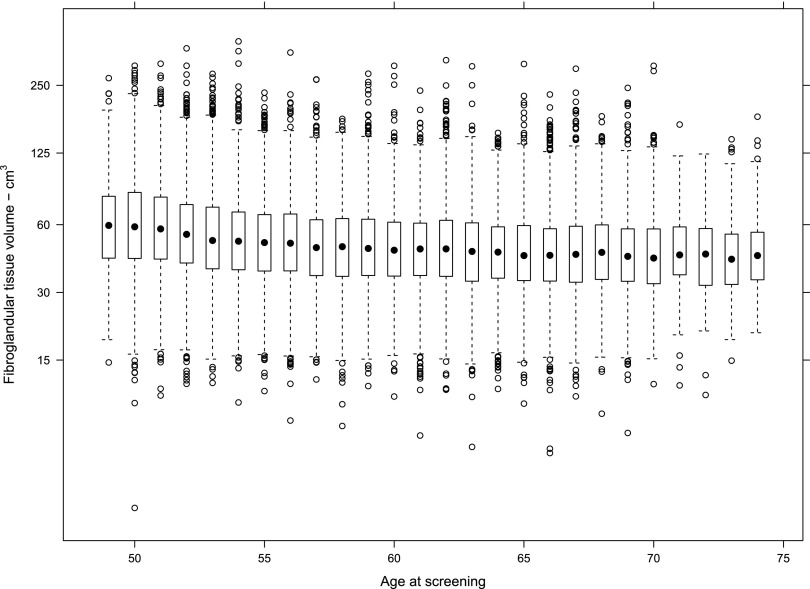
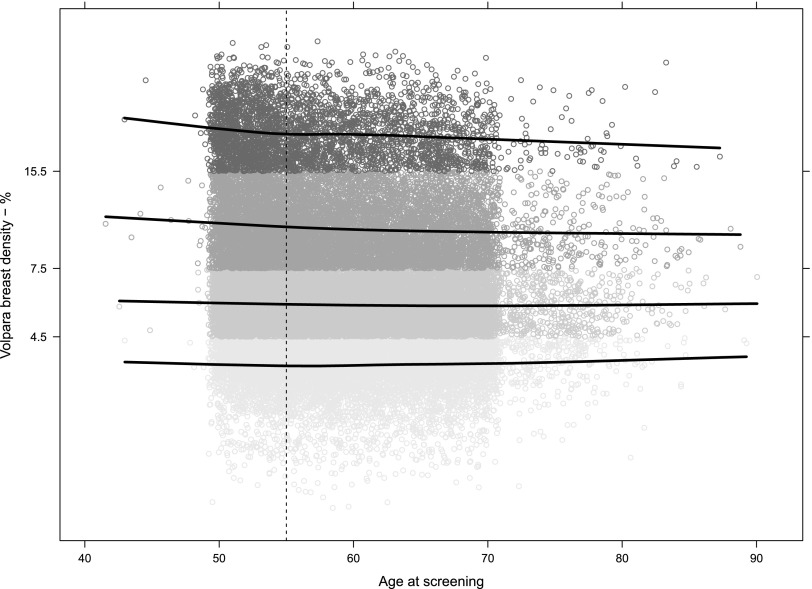
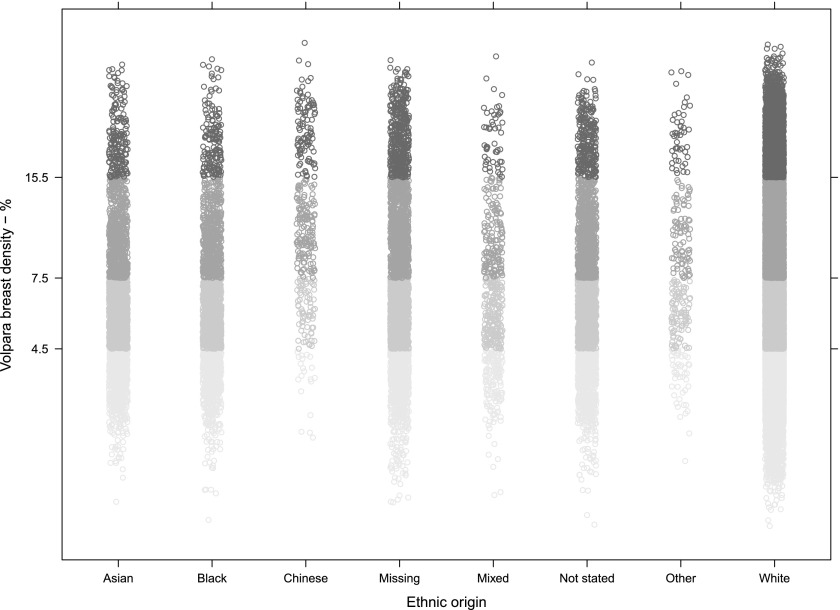
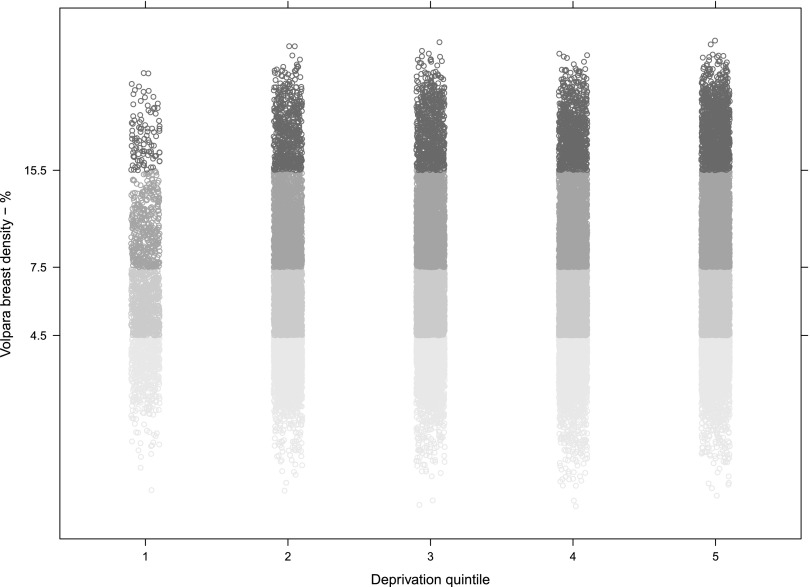
Results: Study population demonstrates little difference for BV with respect to age, but a slight negative trend was noted when FGV was evaluated vs age. Density was linked to ethnicity: females of Chinese ethnicity had higher BD largely reflecting their lower BV. Females in the most deprived quintiles tended to have larger and therefore less dense breasts.

Conclusion: Our mapping of BD in a regional screening programme demonstrates impact of age, ethnicity and socioeconomic status on BD with attendant implications for breast cancer risk.

Advances in knowledge: BD is a known risk factor for development of breast cancer. Density trends in a large regional screening population with respect to age, ethnicity and socioeconomics may eventually help identify the risk of breast cancer in certain subsets of the population.


Figures

Figure 1.
Figure 1.
Mammographic Volpara breast density (Grades 1–4).
Figure 2.
Figure 2.
Age distribution in the study screening population by prevalent and incident screen.
Figure 3.
Figure 3.
Breast volume (estimated by Volpara) by age at screening (n = 32,685). Each circle represents one case measurement. The line is a LOESS smoother for the data and shows that the central tendency is very slightly higher in the age range 56–64 years. The volume measurements are right skewed, so they are shown on a log scale to produce an approximately normal distribution on each chart.
Figure 4.
Figure 4.
Fibroglandular tissue volume (estimated by Volpara) by age at screening (n = 32,685). Each circle represents one measurement; the line is a LOESS smoother for the data and shows that the central tendency declines most noticeably in the age range 50–60 years. Data are shown on a log scale to produce an approximately normal distribution.
Figure 5.
Figure 5.
Fibroglandular tissue volume (FGV) (estimated by Volpara) by age at screening (n = 32,685). Shown on a log scale to produce an approximately normal distribution. The box-and-whisker charts show that the median FGV is higher in younger females, but the variability of the measurements is similar for each age group.
Figure 6.
Figure 6.
Volpara percentage breast density by age. The data are presented on a log scale to get a normal distribution. The y-axis tick labels and the shades indicate the density group: <4.5% = Grade 1, 4.5–7.5% = Grade 2, 7.5–15.5% = Grade 3 and >15.5% = Grade 4. Grade 2 is approximately twice as dense as Grade 1 and so on. The lines are LOESS smoothers for each grade. They show that the tendency for younger females to have denser breasts is more obvious in Grades 3 and 4. Above age 55 years (marked with the vertical dashed line), the tendencies are less clear.
Figure 7.
Figure 7.
Volpara percentage breast density by ethnic group. The data are presented on a log scale to get a normal distribution. The y-axis tick labels and the shades of grey indicate the density group: below 4.5% is Grade 1, 4.5–7.5% Grade 2, 7.5–15.5% Grade 3 and Grade 4 above that.
Figure 8.
Figure 8.
Volpara percentage breast density by deprivation quintile. The data are again presented on a log scale to get a normal distribution. The y-axis tick labels and the shades of grey indicate the density group: below 4.5% is Grade 1, 4.5–7.5% Grade 2, 7.5–15.5% Grade 3 and Grade 4 above that. The x-axis shows the deprivation quintile as defined by the UK Office for National Statistics; quintile 1 defined to be the most deprived, quintile 5 is the least deprived.

References

    1. Cancer Research UK. [Updated 20 February 2015; accessed 9 September 2015]. Available from: http://www.cancerresearchuk.org/health-professional/cancer-statistics/st...
    1. Pace LE, Keating NL. A systematic assessment of benefits and risks to guide breast cancer screening decisions. JAMA 2014; 311: 1327–35. doi: 10.1001/jama.2014.1398 - DOI - PubMed
    1. Onega T, Beaber EF, Sprague BL, Barlow WE, Haas JS, Tosteson AN, et al. . Breast cancer screening in an era of personalized regimens: a conceptual model and National Cancer Institute initiative for risk-based and preference-based approaches at a population level. Cancer 2014; 120: 2955–64. doi: 10.1002/cncr.28771 - DOI - PMC - PubMed
    1. Venturini E, Losio C, Panizza P, Rodigherio MG, Fedele I, Tacchini S, et al. . Tailored breast cancer screening program with microdose mammography, US, and MR Imaging: short-term results of a pilot study in 40-49-year-old women. Radiology 2013; 268: 347–55. doi: 10.1148/radiol.13122278 - DOI - PubMed
    1. Boyd NF, Guo H, Martin LJ, Sun L, Stone J, Fishell E, et al. . Mammographic density and the risk and detection of breast cancer. N Engl J Med 2007; 356: 227–36. doi: 10.1056/NEJMoa062790 - DOI - PubMed