. 2015 Sep 2:6:7990.
doi: 10.1038/ncomms8990.

Hyperspectral light sheet microscopy

Affiliations

Hyperspectral light sheet microscopy

Wiebke Jahr et al. Nat Commun. .

Abstract

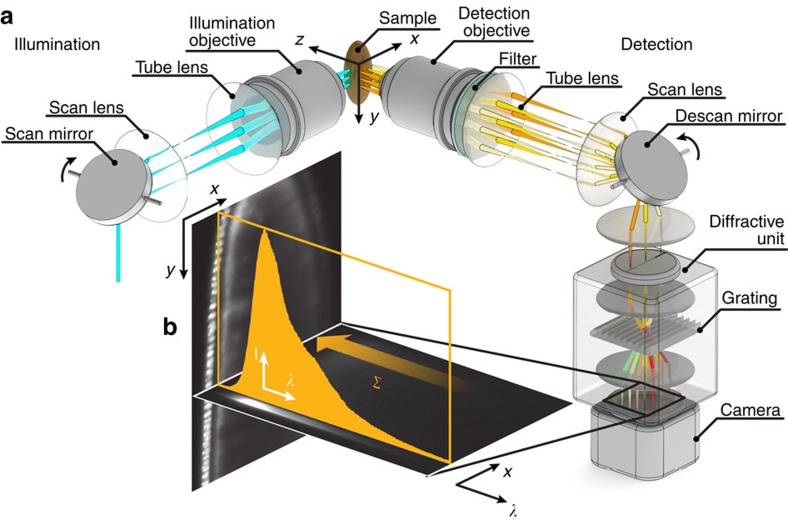
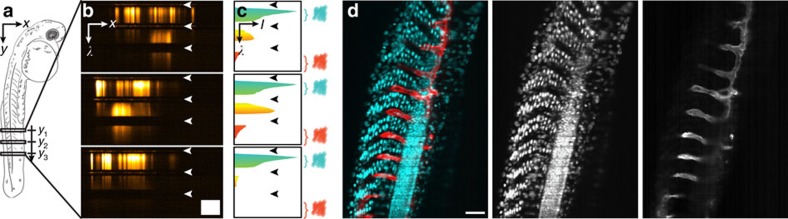
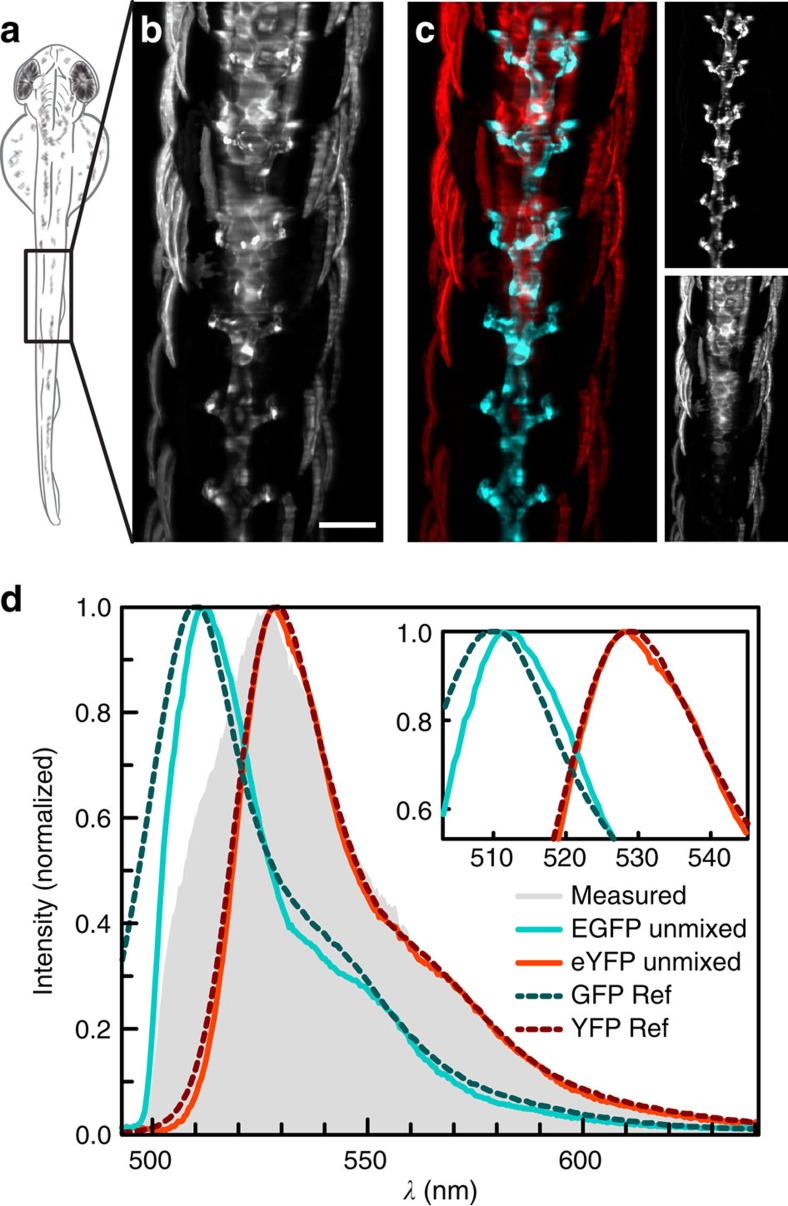
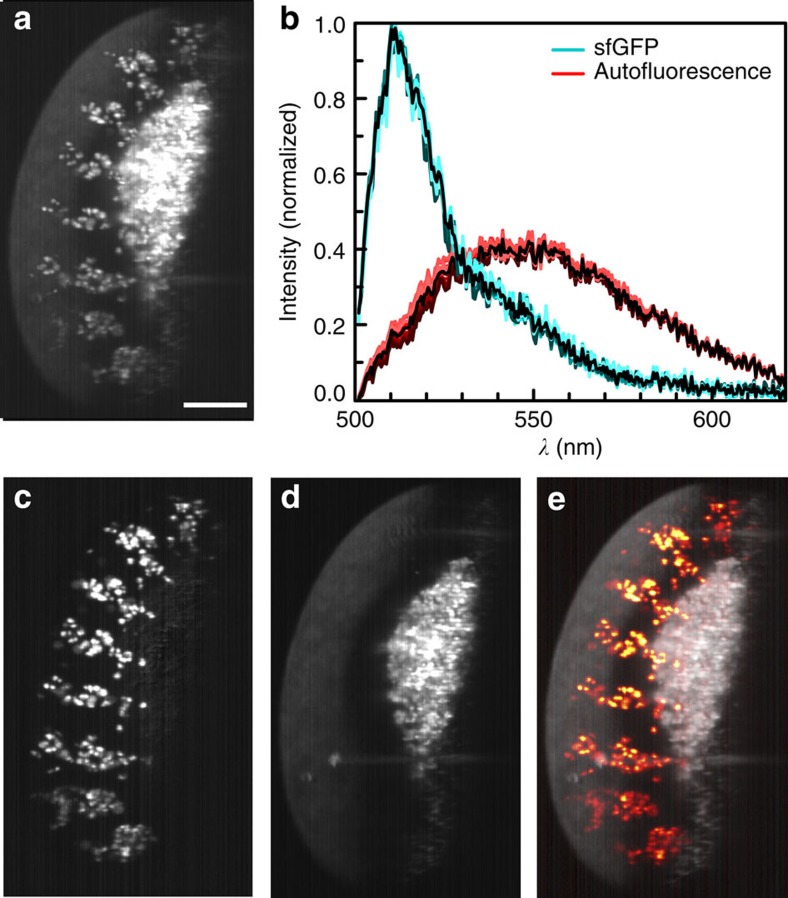
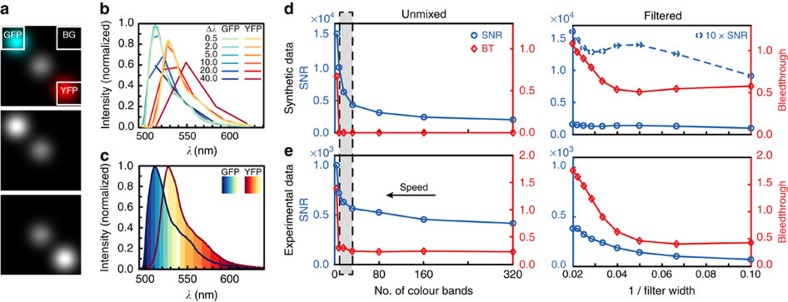
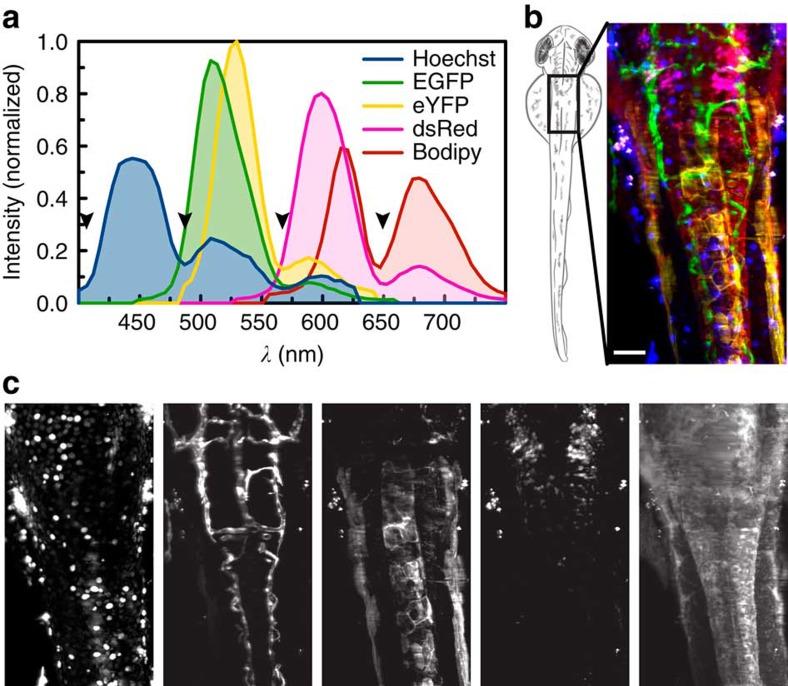
To study the development and interactions of cells and tissues, multiple fluorescent markers need to be imaged efficiently in a single living organism. Instead of acquiring individual colours sequentially with filters, we created a platform based on line-scanning light sheet microscopy to record the entire spectrum for each pixel in a three-dimensional volume. We evaluated data sets with varying spectral sampling and determined the optimal channel width to be around 5 nm. With the help of these data sets, we show that our setup outperforms filter-based approaches with regard to image quality and discrimination of fluorophores. By spectral unmixing we resolved overlapping fluorophores with up to nanometre resolution and removed autofluorescence in zebrafish and fruit fly embryos.


Figures

Figure 1
Figure 1. Hyperspectral SPIM setup and image formation.
(a) Schematic of the setup. The light sheet is created by quickly scanning the illumination beam with a scan mirror. The sample is placed at the intersection of the focal planes of detection and illumination objective and illuminated with the scanned light sheet. The fluorescence signal is descanned onto a single line with a second scan mirror. A diffractive unit separates the spectral components of the incoming light spatially. (b) On the camera chip, a stack of x, λ-data sets was recorded, resulting in a three-dimensional data cube. Summing over all wavelengths (Σ) would yield the conventional, single-colour image. Here, a Drosophila embryo expressing histone-YFP in all cells is shown.
Figure 2
Figure 2. Image formation and virtual filtering.
(a) Schematic drawing of a two days post fertilization zebrafish embryo imaged laterally. (b) Typical x, λ-data sets acquired along three different lines in a Tg(h2afva:h2afva-GFP,kdrl:Hsa.HRAS-mCherry) zebrafish embryo. Spatial information is displayed horizontally, spectral information vertically. Dark horizontal stripes (arrowheads) were caused by the QuadNotch filter blocking scattered illumination light. Scale bar, 100 nm (spectral) × 100 μm (spatial). (c) Spectra were extracted from the x, λ-data sets by integration along the x axis. From the spectra, regions that could be assigned unambiguously to a colour channel were chosen and integrated (‘virtual filtering'). (d) Reconstruction of a dual channel image with cyan (left): 475–555 nm, red (right): 601–718 nm. Scale bar, 100 μm.
Figure 3
Figure 3. Linear unmixing of EGFP and eYFP.
(a) Schematic drawing of a two days post fertilization zebrafish embryo imaged dorsally. (b) Integration of the reconstructed data set from a Tg(kdrl:EGFP,s1013t:Gal4,UAS:ChR2-eYFP) zebrafish along λ. Contributions from EGFP and eYFP could not be distinguished. (c) With linear unmixing, EGFP (cyan) and eYFP (red) were separated and (d) their spectra determined: measured spectrum (grey), EGFP (cyan), eYFP (red). Values from previous studies (dashed) are plotted for comparison. Maximum intensity projections of seven planes, z-spacing 10 μm. Scale bar, 100 μm.
Figure 4
Figure 4. Unmixing of autofluorescence.
(a) A λ-stack of 6 h post-laying Drosophila expressing sens-sfGFP was integrated between 500 and 570 nm to simulate imaging with a standard GFP bandpass filter. Strong autofluorescence in the green spectral region overlapped with the sfGFP signal. (b) Spectra from unmixing: sfGFP (cyan) and autofluorescence (red). Spectra from each plane are plotted in colour, average spectra black. (c) After unmixing for two colours, sfGFP was completely separated and (d) autofluorescence removed. (e) Combination of fluorescence and autofluorescence signals provide additional context, here the outline of the sample. γ-values of the autofluorescence signal were adjusted to 0.1 to make sample outlines better visible. Maximum intensity projections of 13 planes, z-spacing 2 μm. Scale bar, 100 μm.
Figure 5
Figure 5. Optimal spectral sampling.
(a) Synthetic data set consisting of spots exhibiting either EGFP (cyan) or eYFP (red) or the mean of both spectra (white). Spectral sampling, 0.5 nm per pixel. White frames, regions used to determine background (BG), bleedthrough (BT) from the EGFP (GFP) and the eYFP channel (YFP). (b) Spectra obtained after downsampling the λ-stack to generate larger spectral sampling and unmixing downsampled data; EGFP (blue), eYFP(red). (c) Dual channel synthetic data with different filter widths was generated by integration starting at short wavelengths for EGFP (blue) and at long wavelengths for eYFP (red). Hues illustrate intervals used to simulate different filter widths. (d) SNR (blue) and BT (red) were determined for the synthetic data set. Hyperspectral, unmixed data shown on the left, dual channel, filtered data on the right. (e) The analysis was repeated for the experimental dataset shown in Fig. 3. For increasing filter widths, both SNR and BT increase. For decreasing number of colour bands, both imaging speed and SNR improve but BT remains constant down to 32 bands, thereby defining the optimal number of bands for hyperspectral imaging (highlighted).
Figure 6
Figure 6. Linear unmixing of five fluorophores.
(a) For imaging five colours, wild-type fish stained with Hoechst or Bodipy as well as fish expressing only EGFP, eYFP or dsRed were imaged to obtain reference spectra. Black arrowheads highlight regions where the signal is suppressed by the QuadNotch Filter. (b) A zebrafish embryo expressing Tg(kdrl:EGFP,s1013t:Gal4,UAS:ChR2-eYFP,ptf1a:dsRed) was stained with Hoechst and Bodipy and imaged dorsally. Pseudo-colour overlay after unmixing the hyperspectral data set with reference spectra. For better visualization, Bodipy intensity is reduced to 75%. (c) Individual channels, from left to right: Hoechst (blue), EGFP (green), eYFP (yellow), dsRed (magenta) and Bodipy (red). Maximum intensity projections of 65 planes, z-spacing 2 μm. Scale bar, 100 μm.

References

    1. Mahou P., Vermot J., Beaurepaire E. & Supatto W. Multicolor two-photon light-sheet microscopy. Nat. Methods 11, 600–601 (2014) . - PubMed
    1. Dickinson M. E., Bearman G., Tille S., Lansford R. & Fraser S. E. Multi-spectral imaging and linear unmixing add a whole new dimension to laser scanning fluorescence microscopy. Biotechniques 31, 1272–1278 (2001) . - PubMed
    1. Cha J. W. et al. Spectral-resolved multifocal multiphoton microscopy with multianode photomultiplier tubes. Opt. Express 22, 21368–21381 (2014) . - PMC - PubMed
    1. Cutler P. J. et al. Multi-color quantum dot tracking using a high-speed hyperspectral line-scanning microscope. PLoS ONE 8, 64320 (2013) . - PMC - PubMed
    1. Huisken J., Swoger J., Bene F. D., Wittbrodt J. & Stelzer E. H. K. Optical sectioning deep inside live embryos by selective plane microscopy. Science 305, 1007–1009 (2004) . - PubMed

Publication types

Substances