Review
. 2015;9(9):821-34.
doi: 10.2217/bmm.15.52. Epub 2015 Sep 1.

Translational metabolomics in cancer research

Affiliations
Review

Translational metabolomics in cancer research

Nathaniel W Snyder et al. Biomark Med. 2015.

Abstract

Over the last decade there has been a bottleneck in the introduction of new validated cancer metabolic biomarkers into clinical practice. Unfortunately, there are no biomarkers with adequate sensitivity for the early detection of cancer, and there remain a reliance on cancer antigens for monitoring treatment. The need for new diagnostics has led to the exploration of untargeted metabolomics for discovery of early biomarkers of specific cancers and targeted metabolomics to elucidate mechanistic aspects of tumor progression. The successful translation of such strategies to the treatment of cancer would allow earlier intervention to improve survival. We have reviewed the methodology that is being used to achieve these goals together with recent advances in implementing translational metabolomics in cancer.

Keywords: NMR spectroscopy; cancer; cancer diagnosis; diagnostic biomarkers; lipidomics; liquid chromatography-mass spectrometry; prognostic biomarkers; untargeted metabolomics targeted metabolomics.


Conflict of interest statement

Financial & competing interests disclosure

The authors have no other relevant affiliations or financial involvement with any organization or entity with a financial interest in or financial conflict with the subject matter or materials discussed in the manuscript apart from those disclosed.

No writing assistance was utilized in the production of this manuscript.

Figures

Figure 1
Figure 1. Metabolic reprogramming in cancer cells
In cancer cells an increased uptake of glucose occurs as well as diversion of glycolytic intermediates to biosynthetic pathways including nucleosides, amino acids and lipids, which support cell growth and proliferation. Up and down arrows indicate cancer-associated upregulation/activation or downregulation/inhibition of enzymes. Alterations in red can be caused by the activation of HIF-1. CA9 and 12: Carbonic anhydrase 9 and 12; CPT: Carnitine palmitoyltransferase; GLUT: Glucose transporter: GSH: Glutathione; HIF: Hypoxia inducible factor: IDO: Indoleamine, 2,3,-dioxygenase: HK: Hexokinase; LAT1: L-type amino acid transporter: LDHA: Lactate dehydrogenase isoform A; MCT: Monocarboxylate transporter; OXPHOS: Oxidative phosphorylation; PDH: Pyruvate dehydrogenase; PDK: Pyruvate dehydrogenase kinase; PFK: Phosphofructokinase; P13K: Phosphatidylinositol 3-kinase; PGM: Phosphoglycerate mutase; PKM2: Pyruvate kinase isoform M2; PPP: Pentose phosphate pathway; SCO2: Synthesis of cytochrome c oxidase 2; TLK: Transketolase; VDAC: Voltage-dependent anion channel. Reproduced with permission from [35] © Elsevier.
Figure 2
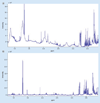
Figure 2. A 500 MHz 1H NMR spectrum of blood plasma sample: (A) before and (B) after protein removal
Reproduced with permission from [9].
Figure 3
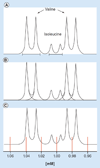
Figure 3. Representative 600 MHz 1H NMR spectra showing the methyl resonances of 20 mM valine and 5 mM isoleucine (A) with manual integration of defined regions, (B) after deconvolution with peak fitting and (C) using binned integral regions
Fitted data in (B) are shown in blue and green for valine and isoleucine, respectively, with the residual discrepancy between calculated and actual spectrums shown as a dashed red line. Peak fitting was performed by ACDlabs Spectrum Processor. Reproduced with permission from [8].
Figure 4
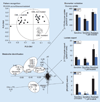
Figure 4. Partial least-squares-discriminant analysis and biomarker validation to distinguish metabolic signatures of responsiveness and resistance to imatinib in human Bcr-Abl positive cells from CML patients
The leukemic cell lines K562 and LAMA84 were treated with imatinib (1µM) for 24 h. Statistical PLS-DA on high-resolution 1H NMR spectra (both extras and medium spectra sets were used) allows for group clustering sensitive untreated cells (gray squares) versus sensitive cells treated with imatinib (black circles) versus resistant cells treated with imatinib (open triangles). The group clustering was based on changes in glucose, lactate, choline intermediates and glutamine, with a minor contribution from creatinine and alanine.*p < 0.05; **p < 0.01; ***p < 0.001. Cho: Choline; CML: Chronic myeloid leukemia; GPC: Glycerophosphocholine; PC: Phosphocholine; tCr: Total creatine (includes creatine and phosphocreatine). Reproduced with permission from [16].
Figure 5
Figure 5. Diagram showing the general mass range and polarity ranges covered by different MS ionization and chromatography techniques
Reproduced with permission from [5].
Figure 6
Figure 6. Comparison of spectra between high- and low-resolution mass spectrometers
(A) High-resolution lysolipid spectra obtained on a Thermo Fisher Orbitrap with a resolution of 30,000. (B) Low-resolution lysolipid spectra obtained on an AB Sciex 4000 QTrap with a resolution of 600. Reproduced with permission from [6]. © American Chemical Society (2013).

Similar articles

Cited by

References

    1. O’Connell TM. Recent advances in metabolomics in oncology. Bioanalysis. 2012;4(4):431–451. - PubMed
    1. Blair IA. Eliminating Bottlenecks for Efficient Bioanalysis: Practices and Applications in Drug Discovery and Development. London, UK: Future Science Group; 2015. Bioanalysis supporting disease biomarker discovery and validation; pp. 162–181.
    1. Blair IA. Analysis of estrogens in serum and plasma from postmenopausal women: past present, and future. Steroids. 2010;75(4–5):297–306. - PMC - PubMed
    1. Lei Z, Huhman DV, Sumner LW. Mass spectrometry strategies in metabolomics. J. Biol. Chem. 2011;286(29):25435–25442. - PMC - PubMed
    1. Forcisi S, Moritz F, Kanawati B, Tziotis D, Lehmann R, Schmitt-Kopplin P. Liquid chromatography-mass spectrometry in metabolomics research: mass analyzers in ultra high pressure liquid chromatography coupling. J. Chromatogr. A. 2013;1292:51–65. - PubMed

Publication types

LinkOut - more resources