. 2015 Sep 1;75(17):3505-18.
doi: 10.1158/0008-5472.CAN-15-0139.

Tuning Sensitivity of CAR to EGFR Density Limits Recognition of Normal Tissue While Maintaining Potent Antitumor Activity

Affiliations

Tuning Sensitivity of CAR to EGFR Density Limits Recognition of Normal Tissue While Maintaining Potent Antitumor Activity

Hillary G Caruso et al. Cancer Res. .

Abstract

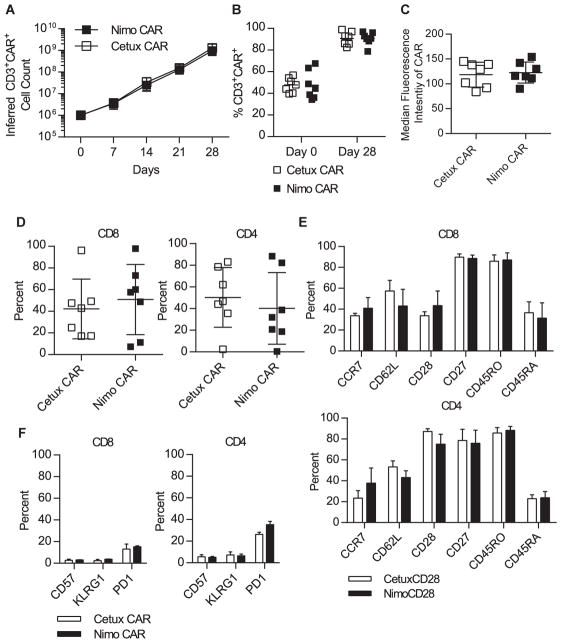
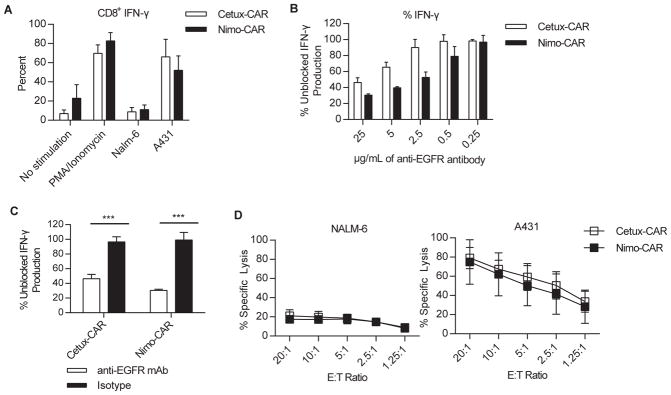
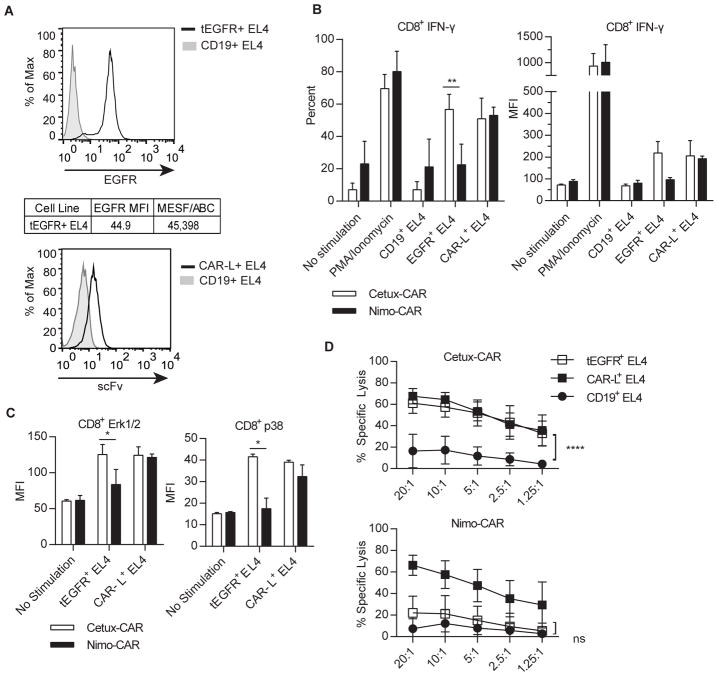
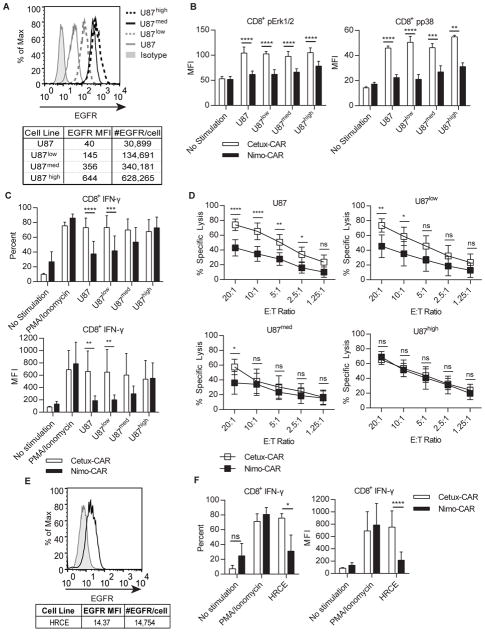
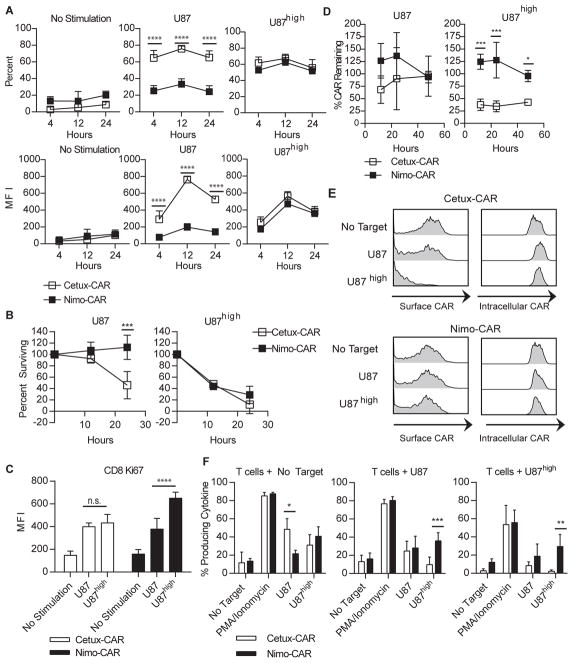
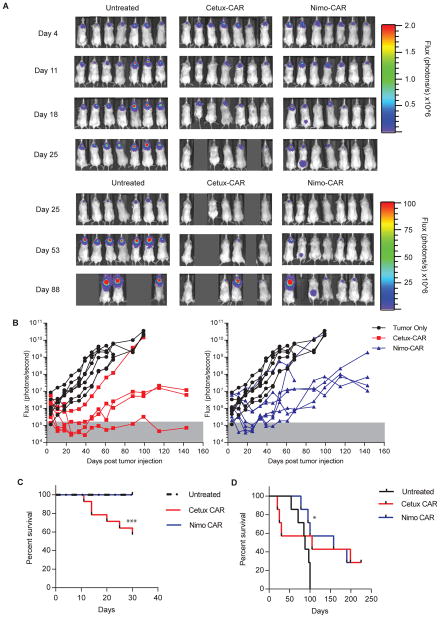
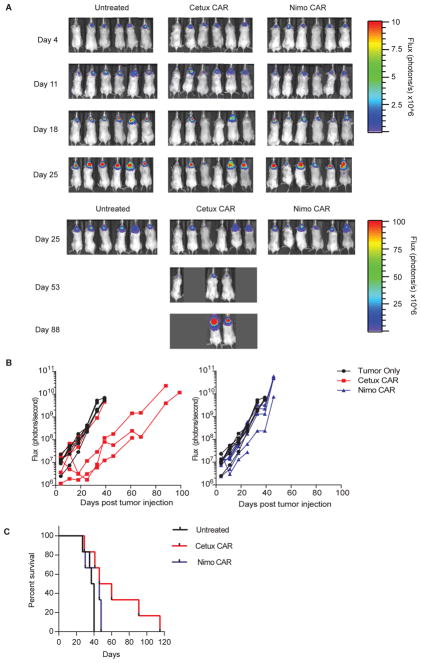
Many tumors overexpress tumor-associated antigens relative to normal tissue, such as EGFR. This limits targeting by human T cells modified to express chimeric antigen receptors (CAR) due to potential for deleterious recognition of normal cells. We sought to generate CAR(+) T cells capable of distinguishing malignant from normal cells based on the disparate density of EGFR expression by generating two CARs from monoclonal antibodies that differ in affinity. T cells with low-affinity nimotuzumab-CAR selectively targeted cells overexpressing EGFR, but exhibited diminished effector function as the density of EGFR decreased. In contrast, the activation of T cells bearing high-affinity cetuximab-CAR was not affected by the density of EGFR. In summary, we describe the generation of CARs able to tune T-cell activity to the level of EGFR expression in which a CAR with reduced affinity enabled T cells to distinguish malignant from nonmalignant cells.


Conflict of interest statement

Competing Interests: Some of the technology described in this presentation was advanced through research conducted at the MD Anderson Cancer Center under the direction of Laurence J.N. Cooper, M.D., Ph.D. In January 2015, the technology was licensed for commercial application to ZIOPHARM Oncology., and Intrexon Corporation in exchange for equity interests in each of these companies for which the following authors. MD Anderson Cancer Center, and the following authors have a financial interest in ZIOPHARM Oncology, Inc., and Intrexon Corporation: HG Caruso, LV Hurton, A Najjar, D Rushworth, S Ang, S Olivares, T Mi, K Switzer, H Singh, H Huls, DA Lee, RE Champlin and LJN Cooper. On May 7, 2015, Dr. Cooper was appointed as the Chief Executive Officer at ZIOPHARM. Dr. Cooper is now a Visiting Scientist at MD Anderson where he will continue to supervise the development of this technology. Patent application based on this manuscript filed April 23, 2014.

Figures

Figure 1
Figure 1
Cetux-CAR+ and Nimo-CAR+ T cells are phenotypically similar. (A) Numeric expansion of Cetux-CAR+ and Nimo-CAR+ T cells was determined by calculating fold expansion of CD3+CAR+ T cells, determined by flow cytometry, during each stimulation cycle. Data represented as mean ± SD, n=5. Statistical analysis by two-tailed student’s t-test. (B) Expression of CAR in CD3+ T cells was determined 24 hours after electroporation of CAR and after 28 days of expansion by flow cytometry for the IgG portion of CAR. Data represented as mean, n=7. Statistical analysis performed by two-tailed student’s t-test. (C) Median fluorescence intensity (MFI of CAR expression was determined by flow cytometry for the IgG portion of CAR after 28 days of expansion. Data represented as mean ± SD, n=7. Statistical analysis performed by two-tailed student’s t-test. (D) Proportion of CD4 and CD8 T cells in total T-cell population after 28 days of expansion measured by flow cytometry on gated CD3+CAR+ cells. Data represented as mean ± SD, n=7. (E, F) Expression of T-cell memory and differentiation markers after 28 days of T-cell expansion measured by flow cytometry in gated CD4+ and CD8+ T-cell populations. Data represented as mean ± SD, n=4. Statistical analysis performed by two-way ANOVA with Sidak’s post-test correction.
Figure 2
Figure 2
Cetux-CAR+ and Nimo-CAR+ T cells are activated in response to EGFR. (A) Production of IFN-γ by CD8+CAR+ T cells in response to co-culture with A431 and NALM-6 cell lines measured by intracellular flow cytometry gated on CD8+ cells. Data represented as mean ± SD, n=4,*** p < 0.001, two-way ANOVA (Sidak’s post-test). (B) Production of IFN-γ in response to EGFR+ A431 in the presence of titrating concentrations of EGFR-blocking mAb (clone LA1, Millipore). CAR+ T cells were co-cultured with A431 with EGFR-specific mAb and IFN-γ production was measured by intracellular flow cytometry. Percent of production was calculated as MFI of IFN-γ in gated CD8+ T cells relative to unblocked CD8+ T-cell production. Data represented as mean ± SD, n=3. (C) Production of IFN-γ as measured by intracellular flow cytometry in response to EGFR+ A431 in the presence 25 μg/mL of EGFR-blocking mAb (clone LA1, Millipore). Percent of production was calculated as MFI of IFN-γ in gated CD8+ T cells relative to unblocked CD8+ T-cell production. Data represented as mean ± SD, n=3, *** p<0.001, two-way ANOVA (Sidak’s post-test). (D) Specific lysis of A431 and NALM-6 by CAR+ T cells measured by standard 4 hour chromium release assay. Data represented as mean ± SD, n=4.
Figure 3
Figure 3
Nimo-CAR+ T cells have impaired response to low density of EGFR. (A) Representative histograms of expression of tEGFR on EL4 cells relative to cell lines negative for EGFR. Density of EGFR expression was determined by quantitative flow cytometry. (B) Production of IFN-γ by gated CD8+ CAR+ T cells after co-culture with CD19+, tEGFR+, or CAR-L+ EL4 cells measured by intracellular staining and flow cytometry. Data represented as mean percent ± SD, n=4 and mean fluorescence intensity (MFI) ± SD, ** p<0.01 two-way ANOVA (Sidak’s post-test) and mean fluorescence intensity ± SD, n=2. (C) Phosphorylation of p38 and Erk1/2 by phosflow cytometry in gated CD8+ CAR+ T cells 30 minutes after co-culture with CD19+, tEGFR+, or CAR-L+ EL4 cells. Data represented as mean ± SD, n=2, * p<0.05, two-way ANOVA (Sidak’s post-test). (D) Specific lysis of CD19+, tEGFR+ and CAR-L+ EL4 cells measured by standard 4-hour chromium release assay. Data represented as mean ± SD, n=4, **** p<0.0001, two-way ANOVA (Tukey’s post-test).
Figure 4
Figure 4
Nimo-CAR+ T-cell activation is positively correlated with EGFR density. (A) Representative histogram of EGFR expression on series of four U87-derived tumor cell lines (U87, U87low, U87med, and U87high) measured and quantified by flow cytometry. Data is representative from triplicates. (B) Phosphorylation of Erk1/2 and p38 in gated CD8+ T cells after 45 minutes of co-culture with U87 cell lines by phosflow cytometry. Data represented as MFI ± SD, n=4, **** p<0.0001, *** p<0.001, ** p<0.01, two-way ANOVA (Sidak’s post-test). (C) Production of IFN-γ by gated CD8+ CAR+ T cells in response to co-culture with U87 cell lines measured by intracellular staining and flow cytometry. Data represented as mean percent ± SD and mean fluorescence intensity ± SD, n=4, **** p<0.0001, *** p<0.001, ** p<0.01, two-way ANOVA (Sidak’s post-test). (D) Specific lysis of U87 cell lines by CAR+ T cells measured by standard 4-hour chromium release assay. Data represented as mean ± SD, n=5, **** p<0.0001, ** p<0.01, * p<0.05, two-way ANOVA (Tukey’s post-test). (E) Representative histogram of expression of EGFR on HRCE measured by flow cytometry. Number of EGFR molecules per cell determined by quantitative flow cytometry. Data are representative of triplicates. (F) Production of IFN-γ by CD8+ CAR+ T cells after co-culture with HRCE measured by intracellular staining and flow cytometry gated on CD8+ cells. Data represented as mean percent ± SD and mean fluorescence intensity ± SD, n=4, ** p<0.01, * p<0.05, ns p>0.05, two-way ANOVA (Sidak’s post-test).
Figure 5
Figure 5
Increasing duration of interaction does not restore Nimo-CAR+ T-cell response to low EGFR density. (A) Production of IFN-γ was measured by intracellular staining and flow cytometry following stimulation with U87 or U87high over time in CD8+ gated cells. Data represented as mean percent producing ± SD, n=4 and mean fluorescence intensity of IFN-γ ± SD, n=4, **** p<0.0001, two-way ANOVA (Sidak’s post-test). (B) Fraction of U87 and U87high cells remaining after co-culture with Cetux-CAR+ or Nimo-CAR+ T cells. U87 cell lines were co-cultured with CAR+ T cells at an E:T ratio of 1:5 in triplicate. Percent surviving was calculated as [cell number harvested after co-culture]/[cell number without T cells]*100. Data represented as mean ± SD, n=3, *** p<0.001, two-way ANOVA (Sidak’s post-test). (C) Proliferation of CAR+ T cells measured by intracellular flow cytometry for Ki-67 in CD8+ gated T cells following 36 hours of co-culture. Data represented as mean fluorescence intensity of Ki-67 ± SD, n=4, *** p<0.001, two-way ANOVA (Tukey’s post-test). (D) Surface expression of CAR during co-culture (E:T 1:5) with parental U87 or U87high measured by flow cytometry for IgG portion of CAR. Data represented as mean ± SD, n=3, *** p<0.001, * p<0.05, two-way ANOVA (Sidak’s post-test) (E) Representative histograms of Intracellular and surface expression of CAR determined by flow cytometry after 24 hours of co-culture with U87 or U87high in CD8+ gated T cells. Data representative of three independent donors. (F) After 24-hours of incubation with U87 or U87high, CAR+ T cells were rechallenged with U87 or U87high and production of IFN-γ CAR+ T cells measured by intracellular staining and flow cytometry gated on CD8+ cells. Data represented as mean ± SD, n=3, *** p<0.001, ** p<0.01, * p<0.05, two-way ANOVA (Sidak’s post-test).
Figure 6
Figure 6
Nimo- and Cetux-CAR+ T cells inhibit high-density EGFR+ glioma growth in vivo. (A) Serial BLI assessed relative size of tumor (introduced on day 0). (B) Relative tumor growth as assessed by serial BLI of tumor. Background luminescence (gray shading) was defined by BLI of mice with no tumors. Significant difference in BLI between mice with no treatment vs. treatment (n=7) with Cetux-CAR+ T cells (n=7, p < 0.01) and no treatment (n=7) vs. treatment with Nimo-CAR+ T cells (n=7, p < 0.05) at day 18, two-way ANOVA (Sidak’s post-test). (C) Survival of mice with U87med-ffLuc-mKate intracranial xenografts from two independent experiments within 7 days of T-cell administration. Significant reduction in survival in Cetux-CAR+ T cell treated mice 8/14 surviving at day 26) relative to untreated mice (14/14 surviving at day 26) determined by Mantel-Cox log-rank test, p = 0.0006. (D) Survival of mice with U87med-ffLuc-mKate intracranial xenografts receiving no treatment, Cetux-CAR+ T cells or Nimo-CAR+ T cells. Significant extension in survival in Nimo-CAR+ T cell treatment group determined by Mantel-Cox log-rank test, p = 0.027.
Figure 7
Figure 7
Nimo-CAR+ T cells exhibit impaired targeting of low-density EGFR cells in vivo. (A) Serial BLI assessed relative size of tumor. (B) Relative tumor growth as assessed by serial BLI of tumor. Significant difference in BLI between mice with no treatment vs. treatment (n=6) with Cetux-CAR+ T cells (n=6, p < 0.01) reached at day 25, two-way ANOVA (Sidak’s post-test). (C) Survival of mice with U87-ffLuc-mKate intracranial xenografts receiving no treatment, Cetux-CAR+ T cells or Nimo-CAR+ T cells. Significant extension in survival in Cetux-CAR+ T-cell treatment group determined by Mantel-Cox log-rank test, p=0.0150.

References

    1. Porter DL, Levine BL, Kalos M, Bagg A, June CH. Chimeric antigen receptor-modified T cells in chronic lymphoid leukemia. The New England journal of medicine. 2011;365(8):725–33. - PMC - PubMed
    1. Grupp SA, Kalos M, Barrett D, Aplenc R, Porter DL, Rheingold SR, et al. Chimeric antigen receptor-modified T cells for acute lymphoid leukemia. The New England journal of medicine. 2013;368(16):1509–18. - PMC - PubMed
    1. Maude SL, Frey N, Shaw PA, Aplenc R, Barrett DM, Bunin NJ, et al. Chimeric antigen receptor T cells for sustained remissions in leukemia. The New England journal of medicine. 2014;371(16):1507–17. - PMC - PubMed
    1. Ostrom QT, Gittleman H, Liao P, Rouse C, Chen Y, Dowling J, et al. CBTRUS statistical report: primary brain and central nervous system tumors diagnosed in the United States in 2007–2011. Neuro-oncology. 2014;16(Suppl 4):iv1–63. - PMC - PubMed
    1. Johnson DR, O’Neill BP. Glioblastoma survival in the United States before and during the temozolomide era. Journal of neuro-oncology. 2012;107(2):359–64. - PubMed

Publication types

MeSH terms