Comparative Study
. 2015 Aug 28:21:955-73.
eCollection 2015.

Chromatin features, RNA polymerase II and the comparative expression of lens genes encoding crystallins, transcription factors, and autophagy mediators

Affiliations
Comparative Study

Chromatin features, RNA polymerase II and the comparative expression of lens genes encoding crystallins, transcription factors, and autophagy mediators

Jian Sun et al. Mol Vis. .

Abstract

Purpose: Gene expression correlates with local chromatin structure. Our studies have mapped histone post-translational modifications, RNA polymerase II (pol II), and transcription factor Pax6 in lens chromatin. These data represent the first genome-wide insights into the relationship between lens chromatin structure and lens transcriptomes and serve as an excellent source for additional data analysis and refinement. The principal lens proteins, the crystallins, are encoded by predominantly expressed mRNAs; however, the regulatory mechanisms underlying their high expression in the lens remain poorly understood.

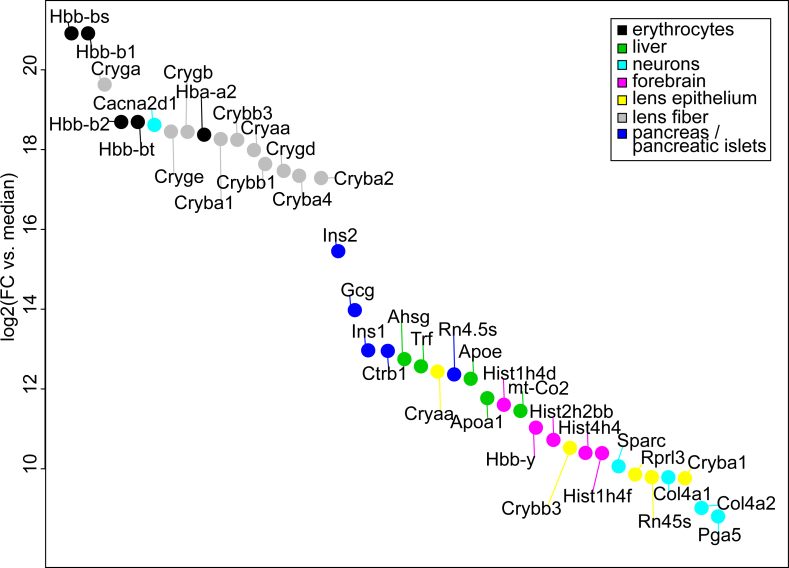
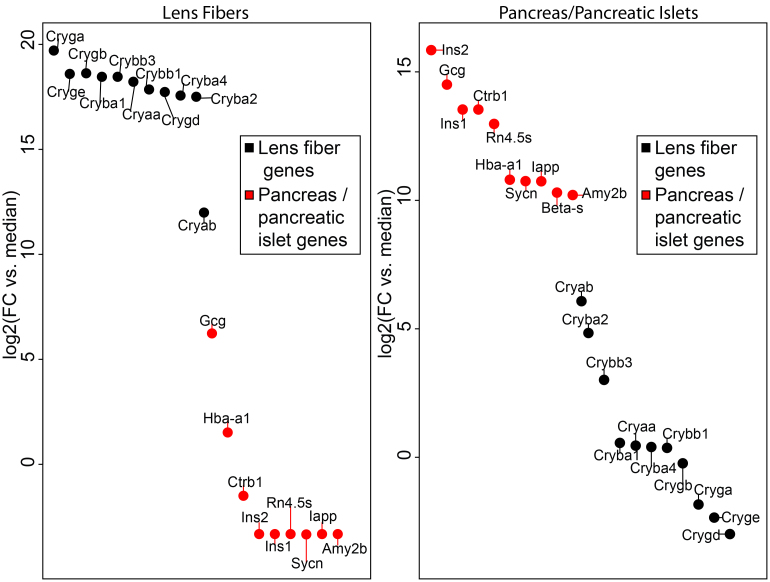
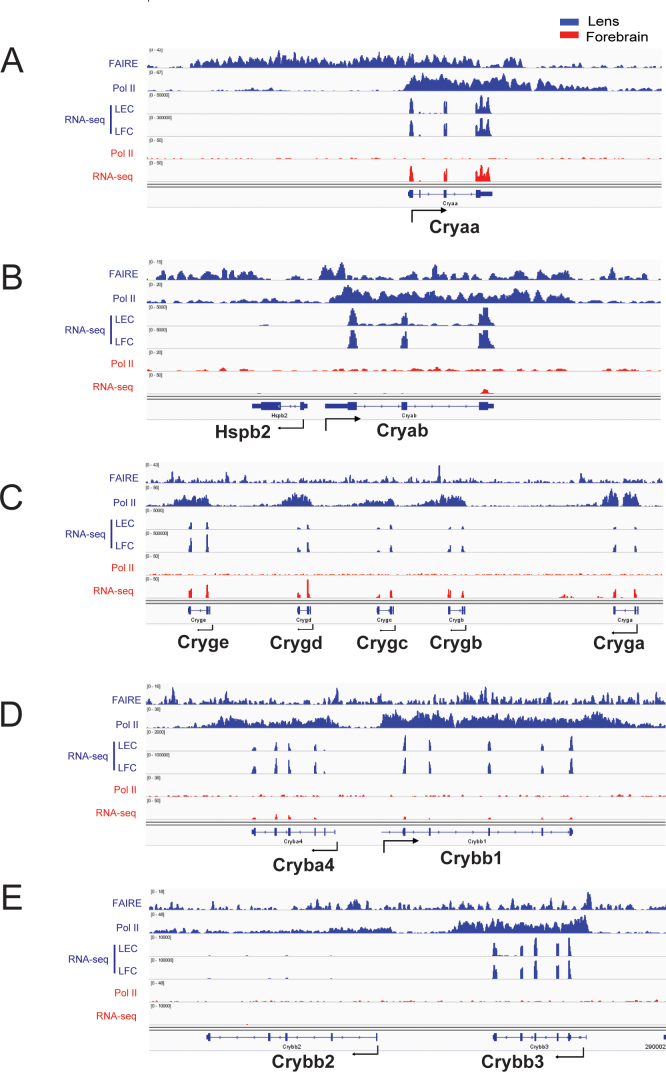
Methods: The formaldehyde-assisted identification of regulatory regions (FAIRE-Seq) was employed to analyze newborn lens chromatin. ChIP-seq and RNA-seq data published earlier (GSE66961) have been used to assist in FAIRE-seq data interpretation. RNA transcriptomes from murine lens epithelium, lens fibers, erythrocytes, forebrain, liver, neurons, and pancreas were compared to establish the gene expression levels of the most abundant mRNAs versus median gene expression across other differentiated cells.

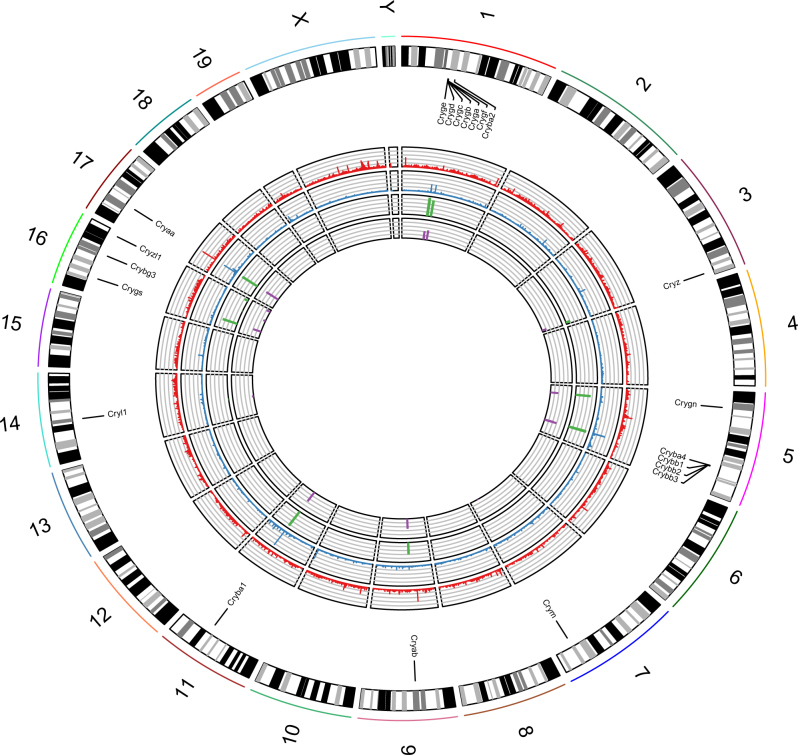
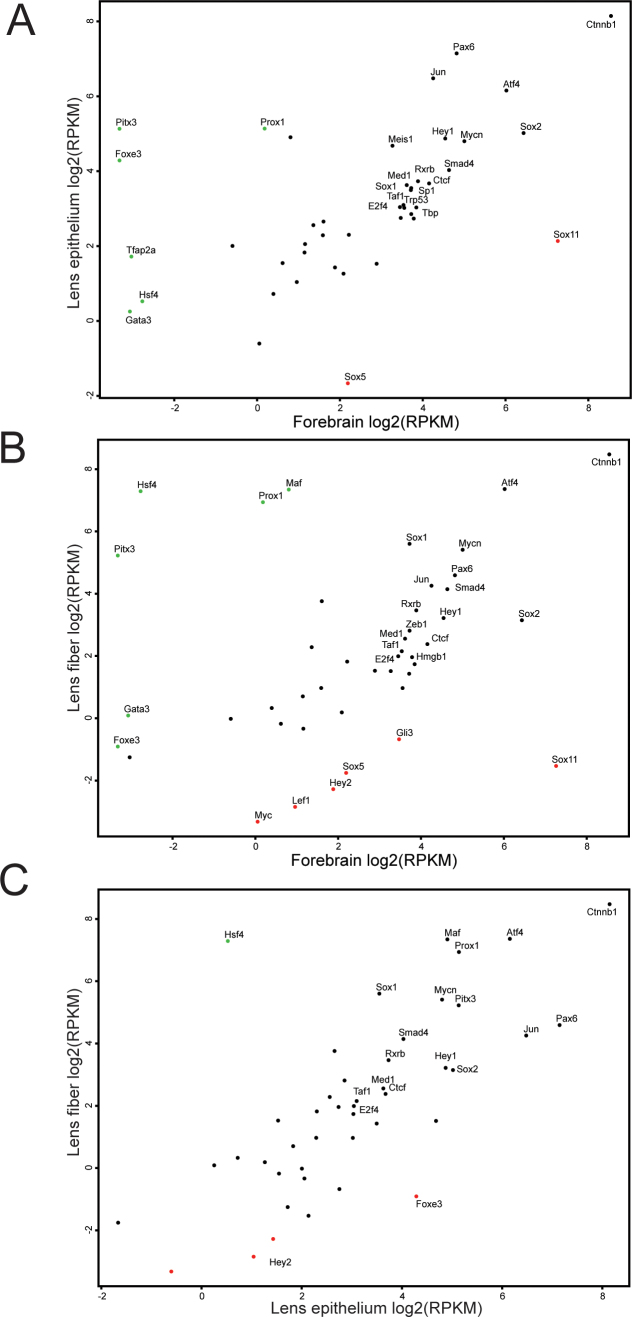
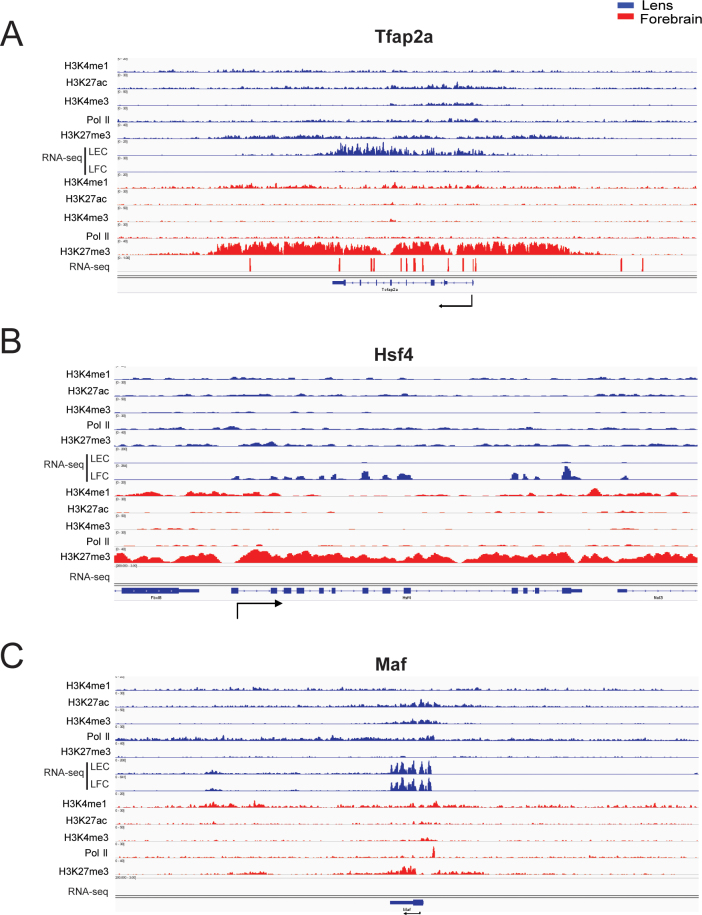
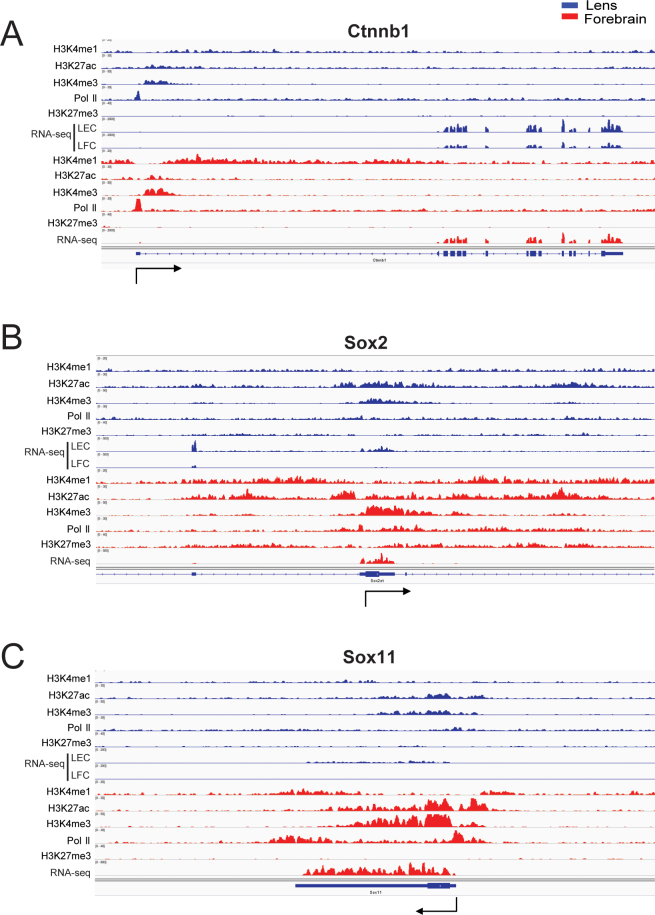
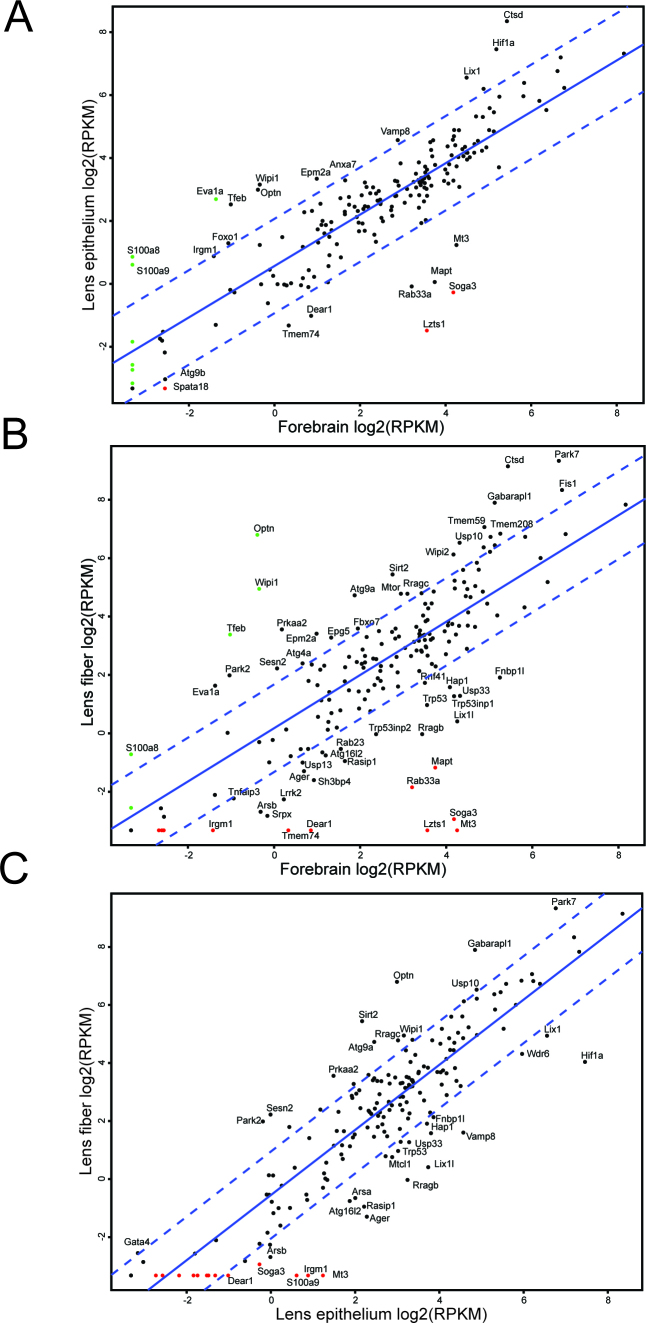
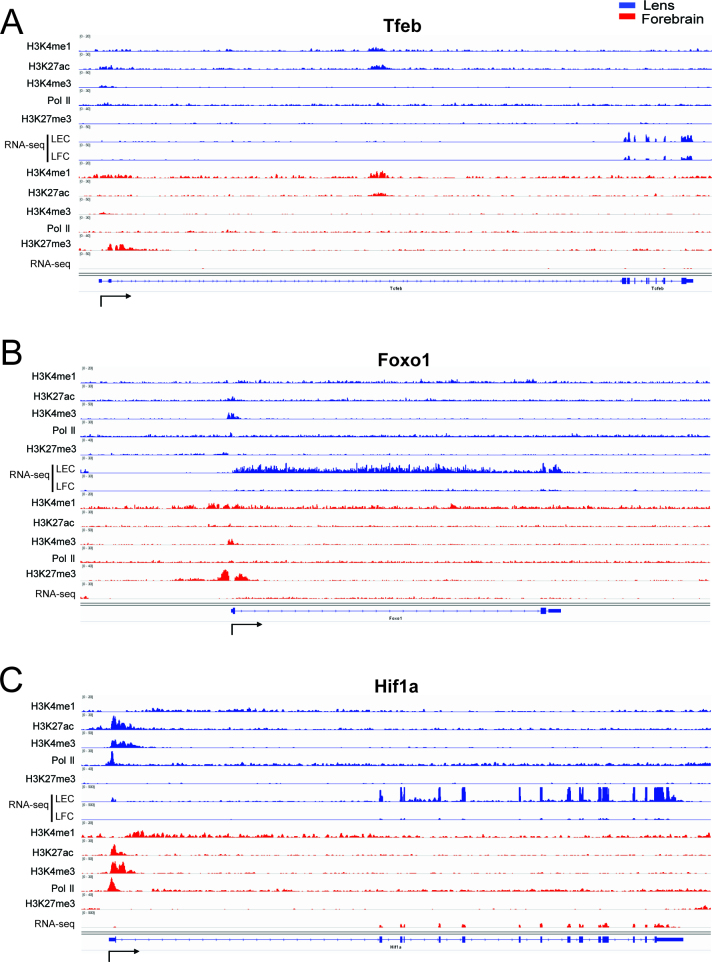
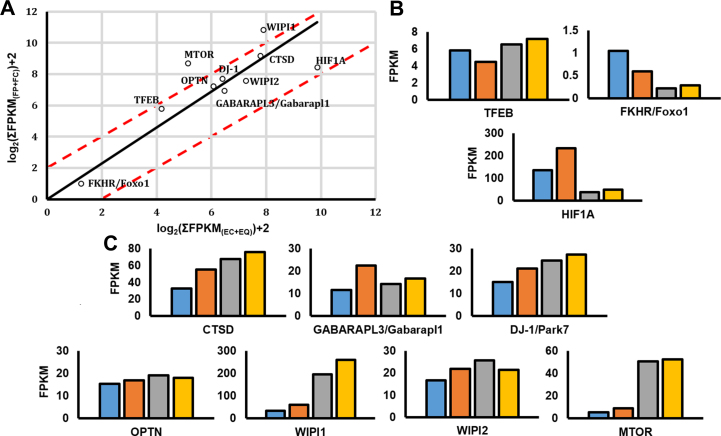
Results: Normalized RNA expression data from multiple tissues show that crystallins rank among the most highly expressed genes in mammalian cells. These findings correlate with the extremely high abundance of pol II all across the crystallin loci, including crystallin genes clustered on chromosomes 1 and 5, as well as within regions of "open" chromatin, as identified by FAIRE-seq. The expression levels of mRNAs encoding DNA-binding transcription factors (e.g., Foxe3, Hsf4, Maf, Pax6, Prox1, Sox1, and Tfap2a) revealed that their transcripts form "clusters" of abundant mRNAs in either lens fibers or lens epithelium. The expression of three autophagy regulatory mRNAs, encoding Tfeb, FoxO1, and Hif1α, was found within a group of lens preferentially expressed transcription factors compared to the E12.5 forebrain.

Conclusions: This study reveals novel features of lens chromatin, including the remarkably high abundance of pol II at the crystallin loci that exhibit features of "open" chromatin. Hsf4 ranks among the most abundant fiber cell-preferred DNA-binding transcription factors. Notable transcripts, including Atf4, Ctcf, E2F4, Hey1, Hmgb1, Mycn, RXRβ, Smad4, Sp1, and Taf1 (transcription factors) and Ctsd, Gabarapl1, and Park7 (autophagy regulators) have been identified with high levels of expression in lens fibers, which suggests specific roles in lens fiber cell terminal differentiation.


Figures

Figure 1
Figure 1
Top expressed genes in terminally differentiated mammalian tissues and organs. The y-axis shows the relative expression levels (versus the median expression level of protein coding genes in the tissue) of the top 10 expressed genes in each tissue. Individual colored dots represent transcripts from different tissues: erythrocytes (black), liver (green), neurons (light blue), forebrain (purple), lens epithelium (yellow), lens fibers (gray), and pancreas/pancreatic islets (dark blue). Hbb-bs (βS-globin, adult s chain), Hbb-b1 (βA-globin adult major chain), Cryga (γA-crystallin), Hbb-b2 (βA-globin adult minor chain), Hbb-bt (βA-globin adult t chain), Cacna2d1 (calcium channel, voltage-dependent, α2/δ subunit 1), Cryge (γE-crystallin), Crygb (γB-crystallin), Hba-a2 (αA-globin adult chain 2), Cryba1 (βA1-crystallin), Crybb3 (βB3-crystallin), Cryaa (αA-crystallin), Crybb1 (βB1-crystallin), Crygd (γD-crystallin), Cryba4 (βA4-crystallin), Cryba2 (βA2-crystallin), Ins2 (insulin II), Gcg (glucagon), Ins1 (insulin I), Ctrb1 (chymotrypsinogen B1), Ahsg (α-2-HS glycoprotein), Trf (transferrin), Rn4.5s (4.5S RNA), Apoe (apolipoprotein E), Apoa1 (apolipoprotein A-1), Hist1h4d (histone cluster 1, H4d), mt-Co2 (cytochrome c oxidase II, mitochondrial), Hist2h2bb (histone cluster 2, H2bb), Hbb-y (hemoglobin Y, β-like embryonic chain), Hist4h4 (histone cluster 4, H4), Sparc (osteonectin), Rprl3 (RNase P RNA-like 3), Rn45s (45S pre-rRNA), Col4a1 (collagen, type IV, alpha 1), Col4a2 (collagen, type IV, alpha 2), and Pga5 (pepsinogen 5, group I).
Figure 2
Figure 2
Gene expression comparison between lens fibers and pancreas/pancreatic islets. A: Visualization of expression levels of top expressed genes in lens fibers (n=10, Cryab also included as it is the most abundant crystallin in the pancreas, black circles) and pancreas genes (red circles). B: Expression levels of top expressed genes in the pancreas (n=10, red circles) and lens crystallins (black circles). The data were calculated as described in the legend for Figure 1.
Figure 3
Figure 3
Rcircos [120] diagram showing “open” chromatin and highly active transcription at many crystallin loci, particularly at the Cryaa. The circles (outermost to innermost) are genome-wide lens FAIRE-seq read density (red), lens pol II ChIP-seq read density (blue), and expression levels (RPKMs) of crystallin genes in lens fibers (green) and lens epithelium (purple). Signals from input lens chromatin have been subtracted for the FAIRE-seq and ChIP-seq data.
Figure 4
Figure 4
Chromatin structure and RNA visualization of representative mouse crystallin genes. A: Cryaa (chromosome 17, length of region shown: 40 kb). B: Cryab-Hspb2 (chromosome 9, length of region shown: 20 kb). C: A cluster of six γ-crystallin genes and βA2-crystallin (Cryba2) is present on chromosome 1. A 100 kb region encompassing five genes, including Cryga, Crygb, Crygc, Crygd, and Cryge, is shown. D: Cryba4-Crybb1 (chromosome 5, length of region shown: 40 kb). E) Crybb2-Crybb3 (chromosome 5, length of region shown: 40 kb). Tracks: Lens (FAIRE-seq, pol II, RNA-seq), forebrain (pol II and RNA-seq). Lens epithelium, LEC; lens fiber cells, LFC.
Figure 5
Figure 5
Differential expression of DNA-binding transcription factors that are highly expressed in lens epithelium and lens fibers. A: Lens epithelium versus forebrain, B: Lens fibers versus forebrain, C: Lens fibers versus lens epithelium.
Figure 6
Figure 6
Chromatin structure of individual loci encoding selected lens-enriched DNA-binding transcription factors. A: Tfap2a. B: Hsf4. C: Maf. Distribution of H3K4me, H3K27ac, H3K4me3, Pol II , H3K27me3 (ChIP-seq), and RNA (RNA-seq) data are from data set GSE66961 [4].
Figure 7
Figure 7
Chromatin structure of individual loci encoding selected forebrain- and lens-enriched transcription factors. A: Ctnnb1. B: Sox2. C: Sox11. See the legend for Figure 6 for details.
Figure 8
Figure 8
Differential gene expression of key autophagy and mitophagy genes. A: Lens epithelium versus forebrain. B: Lens fibers versus forebrain. C: Lens fibers versus lens epithelium.
Figure 9
Figure 9
Chromatin structure of individual loci encoding DNA-binding transcription factors that control autophagy and mitophagy genes. A: Tfeb. B: FoxO1. C: Hif1a. See the legend for Figure 6 for details.
Figure 10
Figure 10
Dynamics of autophagy gene expression in four compartments of E13 embryonic chicken lenses A: Summary of expression data for E13 chicken lenses. B: Tfeb, Foxo1, and Hif1a. C: Ctsd, Gabarapl3 (homolog of Gaparapl1), Park7 (DJ-1), Optn, Wipi1, Wipi2, and Mtor. Central anterior epithelium (blue), equatorial epithelium (orange), cortical fibers (gray), and central fiber core (yellow).

Similar articles

Cited by

References

    1. Hawkins RD, Hon GC, Ren B. Next-generation genomics: an integrative approach. Nat Rev Genet. 2010;11:476–86. - PMC - PubMed
    1. Zhou VW, Goren A, Bernstein BE. Charting histone modifications and the functional organization of mammalian genomes. Nat Rev Genet. 2011;12:7–18. - PubMed
    1. Tsompana M, Buck MJ. Chromatin accessibility: a window into the genome. Epigenetics Chromatin. 2014;7:33. - PMC - PubMed
    1. Sun J, Rockowitz S, Xie Q, Ashery-Padan R, Zheng D, Cvekl A. Identification of in vivo DNA-binding mechanisms of Pax6 and reconstruction of Pax6-dependent gene regulatory networks during forebrain and lens development. Nucleic Acids Res. 2015;; ;:;-;43:6827. - PMC - PubMed
    1. Hoang TV, Kumar PK, Sutharzan S, Tsonis PA, Liang C, Robinson ML. Comparative transcriptome analysis of epithelial and fiber cells in newborn mouse lenses with RNA sequencing. Mol Vis. 2014;20:1491–517. - PMC - PubMed

Publication types