

Discrimination of Human Cell Lines by Infrared Spectroscopy and Mathematical Modeling
- PMID: 26330868
- PMCID: PMC4518108
Discrimination of Human Cell Lines by Infrared Spectroscopy and Mathematical Modeling
Abstract
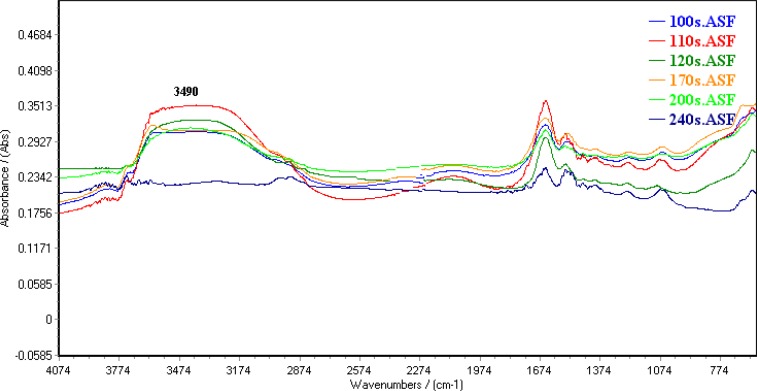
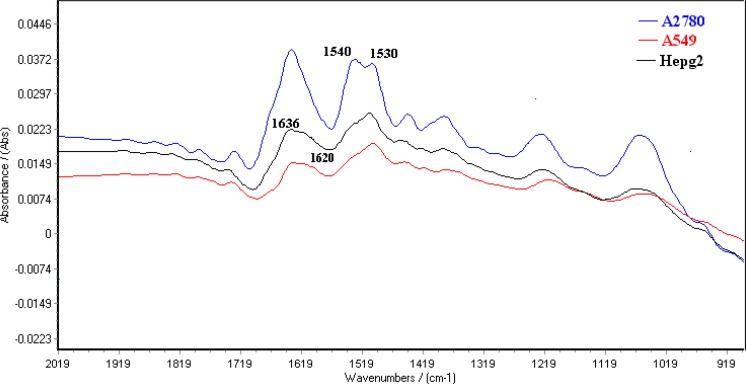
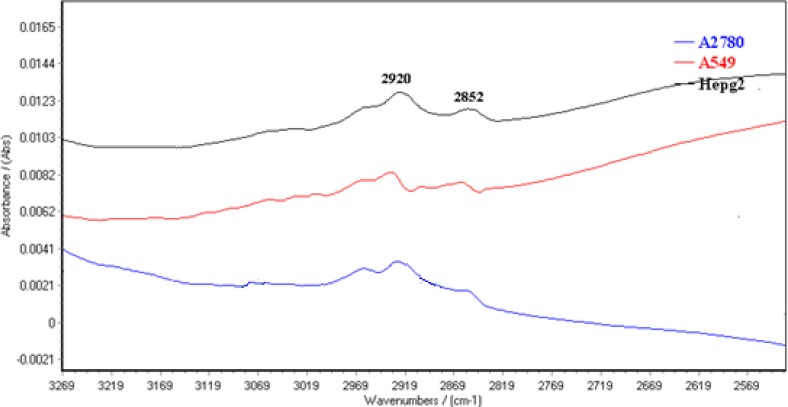
Variations in biochemical features are extensive among cells. Identification of marker that is specific for each cell is essential for following the differentiation of stem cell and metastatic growing. Fourier transform infrared spectroscopy (FTIR) as a biochemical analysis more focused on diagnosis of cancerous cells. In this study, commercially obtained cell lines such as Human ovarian carcinoma (A2780), Human lung adenocarcinoma (A549) and Human hepatocarcinoma (HepG2) cell lines in 20 individual samples for each cell lines were used for FTIR spectral measurements. Data dimension were reduced through principal component analysis (PCA) and then subjected to neural network and linear discrimination analysis to classify FTIR pattern in different cell lines. The results showed dramatic changes of FTIR spectra among different cell types. These appeared to be associated with changes in lipid bands from CH2 symmetric and asymmetric bands, as well as amide I and amid II bands of proteins. The PCA-ANN analysis provided over 90% accuracy for classifying the spectrum of lipid section in different cell lines. This work supports future study to establish the data bank of FTIR feature for different cells and move forward to tissues as more complex systems.
Keywords: Artificial neuronal network; Cell line; Discrimination; Fourier transform infrared; Linear discriminate analysis.
Figures
References
-
- Oleksiak MF, Churchill GA, Crawford DL. Variation in gene expression within and among natural populations. Nat. Genet. 2002;32:261–266. - PubMed
-
- Silberstein GB, Daniel CW. Investigations of mouse mammary ductal growth regulation using slow release implants. J. Dairy Sci. 1987;70:1981–1990. - PubMed
-
- Segers V, Lee F. Stem-cell therapy for cardiac disease. Nature . 2008;451:937–942. - PubMed
LinkOut - more resources
Full Text Sources