. 2015 Sep 1;109(5):914-21.
doi: 10.1016/j.bpj.2015.07.038.

Two-Photon Lifetime Imaging of Voltage Indicating Proteins as a Probe of Absolute Membrane Voltage

Affiliations

Two-Photon Lifetime Imaging of Voltage Indicating Proteins as a Probe of Absolute Membrane Voltage

Daan Brinks et al. Biophys J. .

Abstract

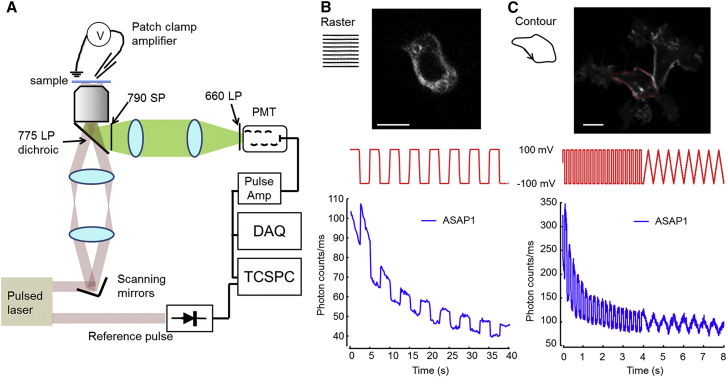
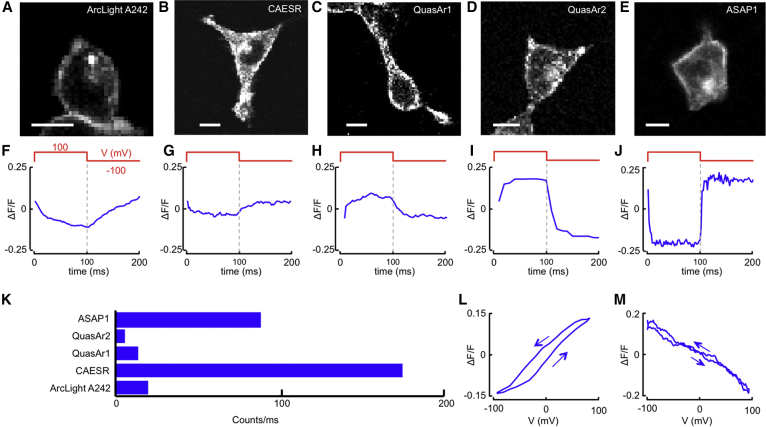
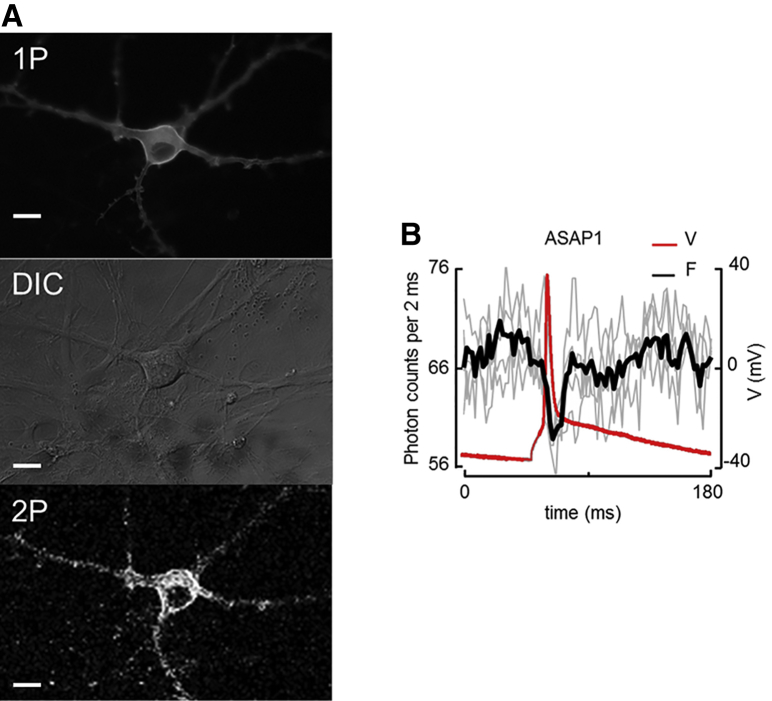
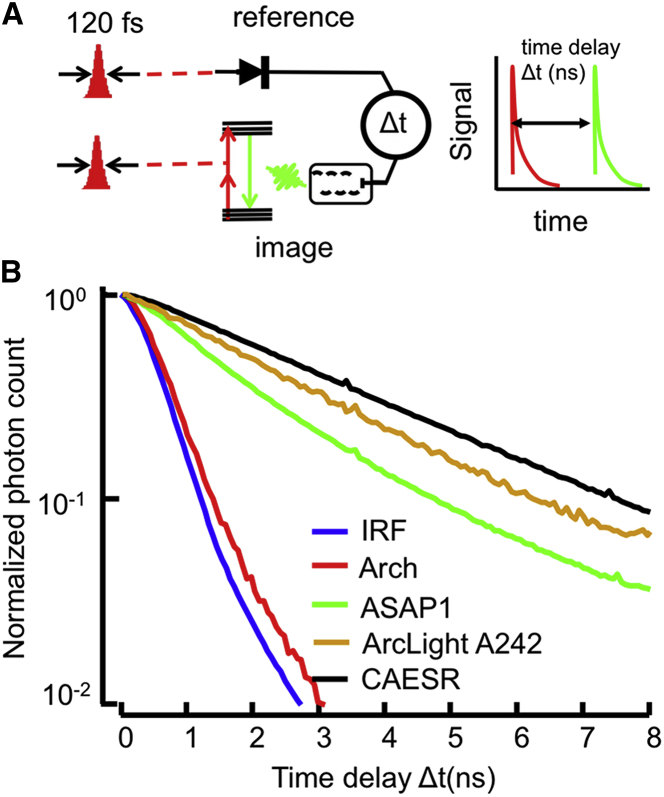
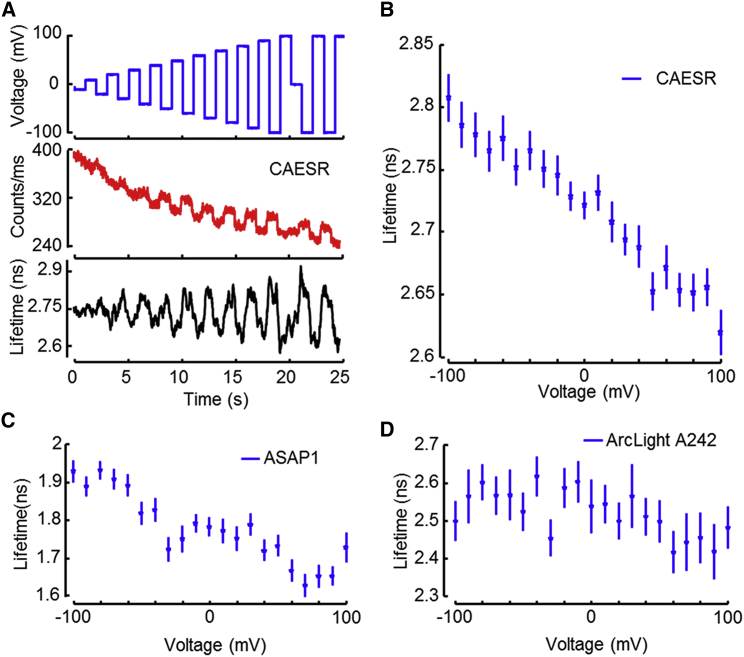
Genetically encoded voltage indicators (GEVIs) can report cellular electrophysiology with high resolution in space and time. Two-photon (2P) fluorescence has been explored as a means to image voltage in tissue. Here, we used the 2P electronic excited-state lifetime to probe absolute membrane voltage in a manner that is insensitive to the protein expression level, illumination intensity, or photon detection efficiency. First, we tested several GEVIs for 2P brightness, response speed, and voltage sensitivity. ASAP1 and a previously described citrine-Arch electrochromic Förster resonance energy transfer sensor (dubbed CAESR) showed the best characteristics. We then characterized the voltage-dependent lifetime of ASAP1, CAESR, and ArcLight under voltage-clamp conditions. ASAP1 and CAESR showed voltage-dependent lifetimes, whereas ArcLight did not. These results establish 2P fluorescence lifetime imaging as a viable means of measuring absolute membrane voltage. We discuss the prospects and improvements necessary for applications in tissue.


Figures

Figure 1
Figure 1
Voltage imaging with 2P fluorescence. (A) A beam-scanning 2P microscope. Laser pulses with a duration of ∼120 fs and tunable wavelength between 950 and 1300 nm were directed into the back aperture of a 60× 1.2 NA water immersion objective via scanning mirrors. Fluorescence at wavelengths shorter than 775 nm was detected by imaging the objective back aperture onto a PMT in a cooled housing. (B) Top: single frame from a movie acquired in raster-scan mode of a HEK cell expressing ASAP1 (Movie S1). Middle: applied membrane voltage, 0.2 Hz step function. Bottom: raw whole-frame fluorescence, sampled at 6 Hz. (C) Top: image of a HEK cell expressing ASAP1, with the contour scan superimposed in red (Movie S2). Middle: applied membrane voltage, 5 Hz step function, 1 Hz ramp function. Bottom: raw fluorescence integrated over the contour, sampled at 500 Hz. Scale bars, 10 μm. To see this figure in color, go online.
Figure 2
Figure 2
Comparison of GEVIs for 2P voltage detection. (A–E) Raster-scanned 2P images of HEK cells expressing (A) ArcLight A242, (B) CAESR, (C) QuasAr1, (D) QuasAr2, and (E) ASAP1. For ArcLight, CAESR, and ASAP1, the image is of the fluorescence of the probe itself, excited with the wavelength that is also used for the voltage-sensitive measurements. For the QuasAr constructs, the image is of a bright fluorescent protein (QuasAr1: mOrange λexc = 1080 nm, QuasAr2: eGFP, λexc = 950 nm) fused to the QuasAr construct to facilitate cell selection. Scale bars, 10 μm. (F–J) ΔF/F in 2P excitation of (F) ArcLight A242, (G) CAESR, (H) QuasAr1, (I) QuasAr2, and (J) ASAP1. (K) Comparison of brightness between the tested GEVIs. (L and M) Fluorescence as a function of membrane voltage for (L) QuasAr2 and (M) ASAP1, recorded for voltages increasing and decreasing with time. The fluorescence shows some hysteresis depending on the direction of the voltage sweep. To see this figure in color, go online.
Figure 3
Figure 3
Detecting neuronal action potentials with 2P excitation. (A) Top: rat hippocampal neuron expressing ASAP1, imaged in 1P fluorescence to assess the protein expression level. Middle: cell imaged in DIC to assess cell health. The culture dish was then transferred to the 2P microscope. Bottom: cell imaged in 2P fluorescence. (B) 2P fluorescence versus time during action potentials elicited by current injection from a patch pipette. The perimeter of the soma was imaged in contour-scan mode and the fluorescence was recorded at 500 Hz. Red, voltage recording; gray, individual fluorescence recordings with an SNR of 1; black, average of three consecutive optical recordings. To see this figure in color, go online.
Figure 4
Figure 4
Apparatus for measuring 2P fluorescence lifetime. (A) Lifetime is detected via TCSPC. Two synchronized femtosecond pulses are emitted by the laser: one is detected on a fast photodiode and the other excites a fluorescent protein whose emission is detected on a PMT. The difference in arrival time between the reference and fluorescence is the lifetime for this excitation. (B) Histograms of the arrival times can be fitted to obtain the mean excited-state lifetime. The instrument response function is 600 ps.
Figure 5
Figure 5
The 2P fluorescence lifetime encodes the absolute voltage. (A) Membrane voltage of a HEK cell expressing CAESR was modulated in 1 s intervals. The fluorescence intensity varied with voltage on top of a rapidly bleaching baseline. The fluorescence lifetime reports changes in voltage without drift in the average value. (B) The lifetime of CAESR can be calibrated to an absolute value of membrane voltage and reported voltage with a sensitivity of Δτ = −0.09 ns per 100 mV. The noise-equivalent voltage was 20 mV in a 1 s bandwidth. (C) The ASAP1 fluorescence lifetime reported absolute voltage with a sensitivity of Δτ = −0.14 ns per 100 mV between ±70 mV, but saturated toward the edges. The noise-equivalent voltage was 30 mV in a 1 s bandwidth. (D) The fluorescence lifetime of ArcLight A242 did not show a discernible dependence on voltage. To see this figure in color, go online.
Figure 6
Figure 6
Comparison of the number and location of probes that contributed to calcium and voltage detection in 1P and 2P excitation. For a given signal rate (photons/s), the rate of photobleaching is inversely proportional to the number of reporter molecules that contribute to this signal. In 1P epifluorescence Ca2+ imaging, the signal comes from the 3D bulk of the cell. In 2P Ca2+ imaging, the signal comes from molecules within a single focal plane. However, relatively fast cytoplasmic diffusion replenishes photobleached molecules, leading to an effective sampling volume close to the 3D bulk. In 1P epifluorescence voltage imaging, voltage-dependent signals can come from the whole-cell membrane. In 2P voltage imaging, only molecules at the equator contribute signal. Diffusion of GEVIs in the lipid membrane is too slow to replace photobleached molecules on an experimentally relevant timescale. For equal count rates of signal-bearing photons, 2P voltage imaging will experience a higher photobleaching rate than 2P Ca2+ imaging.To see this figure in color, go online.

References

    1. Fisher J.A., Barchi J.R., Salzberg B.M. Two-photon excitation of potentiometric probes enables optical recording of action potentials from mammalian nerve terminals in situ. J. Neurophysiol. 2008;99:1545–1553. - PubMed
    1. Acker C.D., Yan P., Loew L.M. Single-voxel recording of voltage transients in dendritic spines. Biophys. J. 2011;101:L11–L13. - PMC - PubMed
    1. Cohen L.B., Salzberg B.M., Wang C.H. Changes in axon fluorescence during activity: molecular probes of membrane potential. J. Membr. Biol. 1974;19:1–36. - PubMed
    1. Salzberg B.M., Grinvald A., Ross W.N. Optical recording of neuronal activity in an invertebrate central nervous system: simultaneous monitoring of several neurons. J. Neurophysiol. 1977;40:1281–1291. - PubMed
    1. Jin L., Han Z., Pieribone V.A. Single action potentials and subthreshold electrical events imaged in neurons with a fluorescent protein voltage probe. Neuron. 2012;75:779–785. - PMC - PubMed

Publication types

Substances