

Bayesian Uncertainty Quantification for Bond Energies and Mobilities Using Path Integral Analysis
- PMID: 26331254
- PMCID: PMC4564684
- DOI: 10.1016/j.bpj.2015.07.028
Bayesian Uncertainty Quantification for Bond Energies and Mobilities Using Path Integral Analysis
Abstract
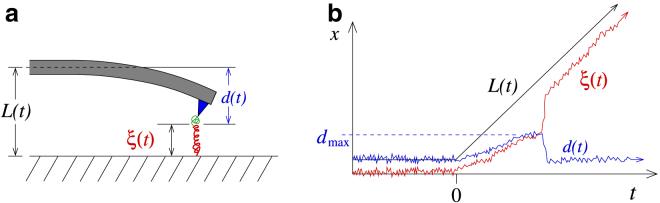
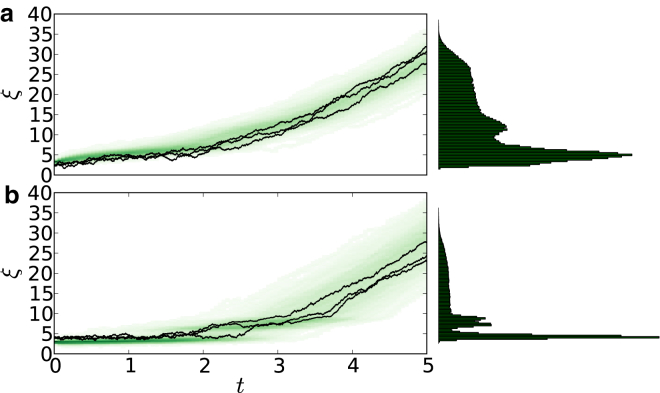
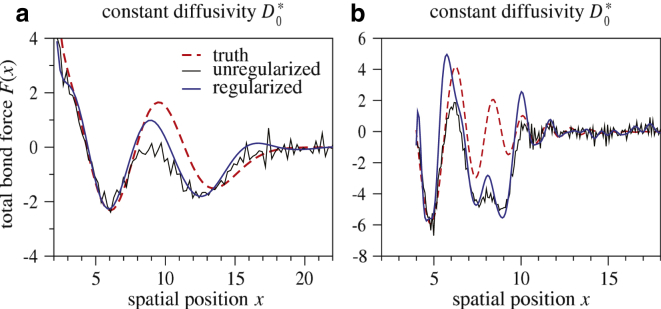
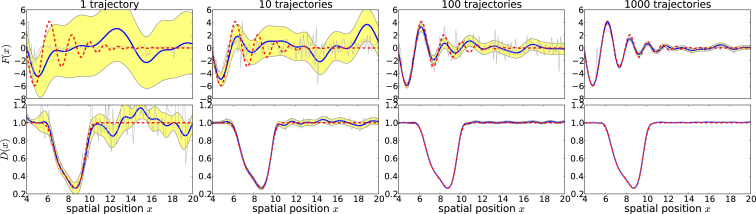
Dynamic single-molecule force spectroscopy is often used to distort bonds. The resulting responses, in the form of rupture forces, work applied, and trajectories of displacements, are used to reconstruct bond potentials. Such approaches often rely on simple parameterizations of one-dimensional bond potentials, assumptions on equilibrium starting states, and/or large amounts of trajectory data. Parametric approaches typically fail at inferring complicated bond potentials with multiple minima, while piecewise estimation may not guarantee smooth results with the appropriate behavior at large distances. Existing techniques, particularly those based on work theorems, also do not address spatial variations in the diffusivity that may arise from spatially inhomogeneous coupling to other degrees of freedom in the macromolecule. To address these challenges, we develop a comprehensive empirical Bayesian approach that incorporates data and regularization terms directly into a path integral. All experimental and statistical parameters in our method are estimated directly from the data. Upon testing our method on simulated data, our regularized approach requires less data and allows simultaneous inference of both complex bond potentials and diffusivity profiles. Crucially, we show that the accuracy of the reconstructed bond potential is sensitive to the spatially varying diffusivity and accurate reconstruction can be expected only when both are simultaneously inferred. Moreover, after providing a means for self-consistently choosing regularization parameters from data, we derive posterior probability distributions, allowing for uncertainty quantification.
Copyright © 2015 Biophysical Society. Published by Elsevier Inc. All rights reserved.
Figures
Comment in
-
Advances in the Theory of Single-Molecule Force Spectroscopy: Bond Potentials and Mobilities.Biophys J. 2015 Sep 1;109(5):851. doi: 10.1016/j.bpj.2015.07.029. Biophys J. 2015. PMID: 26331241 Free PMC article. No abstract available.
Similar articles
-
Part 2. Development of Enhanced Statistical Methods for Assessing Health Effects Associated with an Unknown Number of Major Sources of Multiple Air Pollutants.Res Rep Health Eff Inst. 2015 Jun;(183 Pt 1-2):51-113. Res Rep Health Eff Inst. 2015. PMID: 26333239
-
A Bayesian inference scheme to extract diffusivity and potential fields from confined single-molecule trajectories.Biophys J. 2012 May 16;102(10):2288-98. doi: 10.1016/j.bpj.2012.01.063. Epub 2012 May 15. Biophys J. 2012. PMID: 22677382 Free PMC article.
-
Motion blur filtering: A statistical approach for extracting confinement forces and diffusivity from a single blurred trajectory.Phys Rev E. 2016 May;93(5):053303. doi: 10.1103/PhysRevE.93.053303. Epub 2016 May 12. Phys Rev E. 2016. PMID: 27301001
-
Challenges and Opportunities for Bayesian Statistics in Proteomics.J Proteome Res. 2022 Apr 1;21(4):849-864. doi: 10.1021/acs.jproteome.1c00859. Epub 2022 Mar 8. J Proteome Res. 2022. PMID: 35258980 Free PMC article. Review.
-
A Primer on the Bayesian Approach to High-Density Single-Molecule Trajectories Analysis.Biophys J. 2016 Mar 29;110(6):1209-15. doi: 10.1016/j.bpj.2016.01.018. Biophys J. 2016. PMID: 27028631 Free PMC article. Review.
Cited by
-
Reconstruction of Cell Focal Adhesions using Physical Constraints and Compressive Regularization.Biophys J. 2017 Dec 5;113(11):2530-2539. doi: 10.1016/j.bpj.2017.09.021. Biophys J. 2017. PMID: 29212006 Free PMC article.
-
Xist nucleates local protein gradients to propagate silencing across the X chromosome.Cell. 2021 Dec 9;184(25):6174-6192.e32. doi: 10.1016/j.cell.2021.10.022. Epub 2021 Nov 4. Cell. 2021. PMID: 34813726 Free PMC article.
-
The biophysics of bacterial infections: Adhesion events in the light of force spectroscopy.Cell Surf. 2021 Jan 15;7:100048. doi: 10.1016/j.tcsw.2021.100048. eCollection 2021 Dec. Cell Surf. 2021. PMID: 33665520 Free PMC article.
-
Single molecule localisation microscopy reveals how HIV-1 Gag proteins sense membrane virus assembly sites in living host CD4 T cells.Sci Rep. 2018 Nov 2;8(1):16283. doi: 10.1038/s41598-018-34536-y. Sci Rep. 2018. PMID: 30389967 Free PMC article.
References
-
- Arridge S.R. Optical tomography in medical imaging. Inverse Probl. 1999;15:R41.
-
- Coleman T.F., Li Y., Verma A. Reconstructing the unknown local volatility function. J. Comput. Finance. 1999;2:77–102.
-
- Renò R. Nonparametric estimation of the diffusion coefficient of stochastic volatility models. Econom. Theory. 2008;24:1174–1206.
-
- Heymann B., Grubmüller H. Dynamic force spectroscopy of molecular adhesion bonds. Phys. Rev. Lett. 2000;84:6126–6129. - PubMed
Publication types
MeSH terms
LinkOut - more resources
Full Text Sources
Other Literature Sources
