

Association between rates of caesarean section and maternal and neonatal mortality in the 21st century: a worldwide population-based ecological study with longitudinal data
- PMID: 26331389
- PMCID: PMC5014131
- DOI: 10.1111/1471-0528.13592
Association between rates of caesarean section and maternal and neonatal mortality in the 21st century: a worldwide population-based ecological study with longitudinal data
Abstract
Objective: Caesarean section was initially performed to save the lives of the mother and/or her baby. Caesarean section rates have risen substantially worldwide over the past decades. In this study, we set out to compile all available caesarean section rates worldwide at the country level, and to identify the appropriate caesarean section rate at the population level associated with the minimal maternal and neonatal mortality.
Design: Ecological study using longitudinal data.
Setting: Worldwide country-level data.
Population: A total of 159 countries were included in the analyses, representing 98.0% of global live births (2005).
Methods: Nationally representative caesarean section rates from 2000 to 2012 were compiled. We assessed the relationship between caesarean section rates and mortality outcomes, adjusting for socio-economic development by means of human development index (HDI) using fractional polynomial regression models.
Main outcome measures: Maternal mortality ratio and neonatal mortality rate.
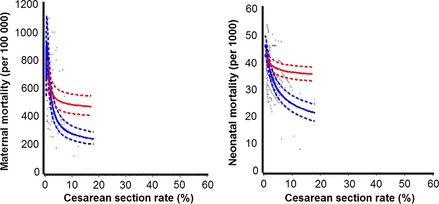
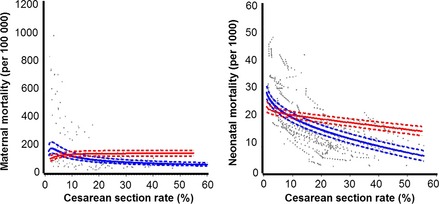
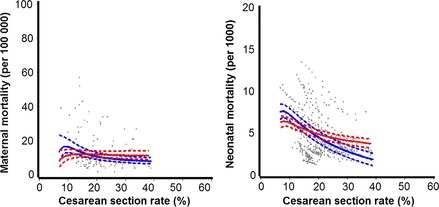
Results: Most countries have experienced increases in caesarean section rate during the study period. In the unadjusted analysis, there was a negative association between caesarean section rates and mortality outcomes for low caesarean section rates, especially among the least developed countries. After adjusting for HDI, this effect was much smaller and was only observed below a caesarean section rate of 5-10%. No important association between the caesarean section rate and maternal and neonatal mortality was observed when the caesarean section rate exceeded 10%.
Conclusions: Although caesarean section is an effective intervention to save maternal and infant lives, based on the available ecological evidence, caesarean section rates higher than around 10% at the population level are not associated with decreases in maternal and neonatal mortality rates, and thus may not be necessary to achieve the lowest maternal and neonatal mortality.
Tweetable abstract: The caesarean section rate of around 10% may be the optimal rate to achieve the lowest mortality.
Keywords: Caesarean section rate; maternal mortality; neonatal mortality.
© 2015 The Authors BJOG An International Journal of Obstetrics and Gynaecology published by John Wiley & Sons Ltd on behalf of Royal College of Obstetricians and Gynaecologists.
Figures
References
-
- Gibbons L, Belizán JM, Lauer JA, Betrán AP, Merialdi M, Althabe F. The Global Numbers and Costs of Additionally Needed and Unnecessary Caesarean Sections Performed per Year: Overuse as a Barrier to Universal Coverage. World Health Report (2010) Background Paper, No 30.
-
- Betran AP, Merialdi M, Lauer JA, Bing‐Shun W, Thomas J, Van Look P, et al. Rates of caesarean section: analysis of global, regional and national estimates. Paediatr Perinat Epidemiol 2007;21:98–113. - PubMed
-
- Robson MS. Can we reduce the caesarean section rate? Best Pract Res Clin Obstet Gynaecol 2001;15:179–94. - PubMed
-
- Ye J, Betran AP, Guerrero Vela M, Souza JP, Zhang J. Searching for the optimal rate of medically necessary cesarean delivery. Birth (Berkeley, Calif) 2014;41:237–44. - PubMed
-
- Appropriate technology for birth. Lancet 1985;2:436–7. - PubMed
MeSH terms
Grants and funding
LinkOut - more resources
Full Text Sources
Other Literature Sources
Medical
Miscellaneous
