. 2015 Sep 10;525(7568):274-7.
doi: 10.1038/nature14882. Epub 2015 Sep 2.

Real-time observation of the initiation of RNA polymerase II transcription

Affiliations

Real-time observation of the initiation of RNA polymerase II transcription

Furqan M Fazal et al. Nature. .

Abstract

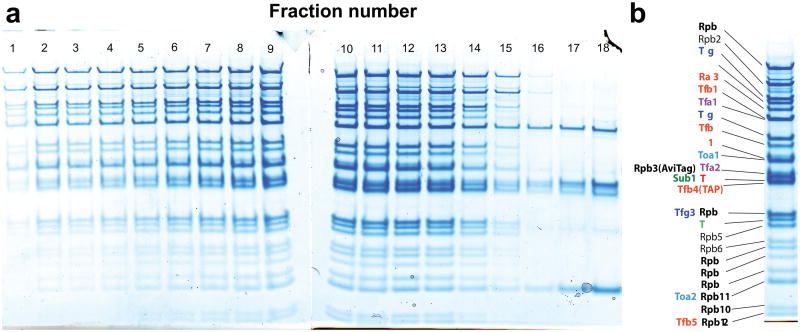
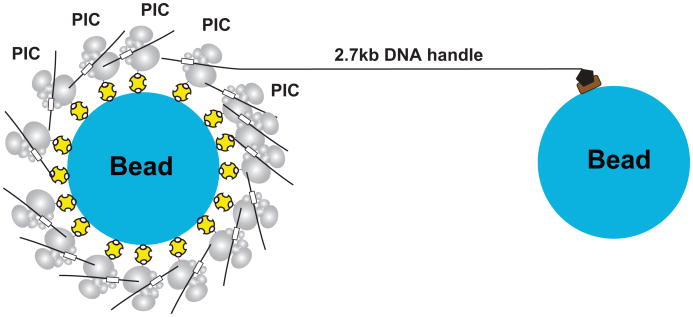
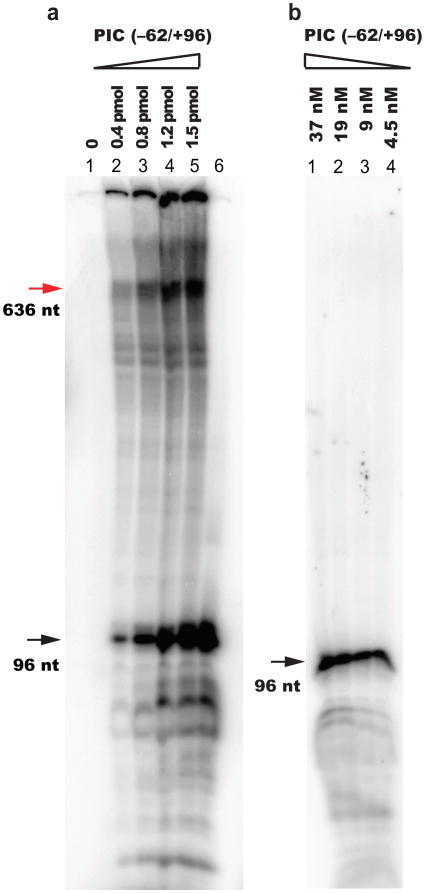
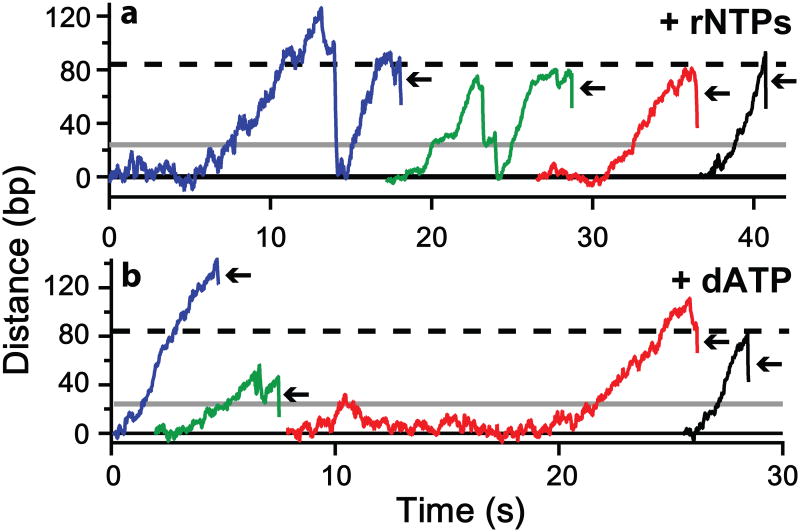
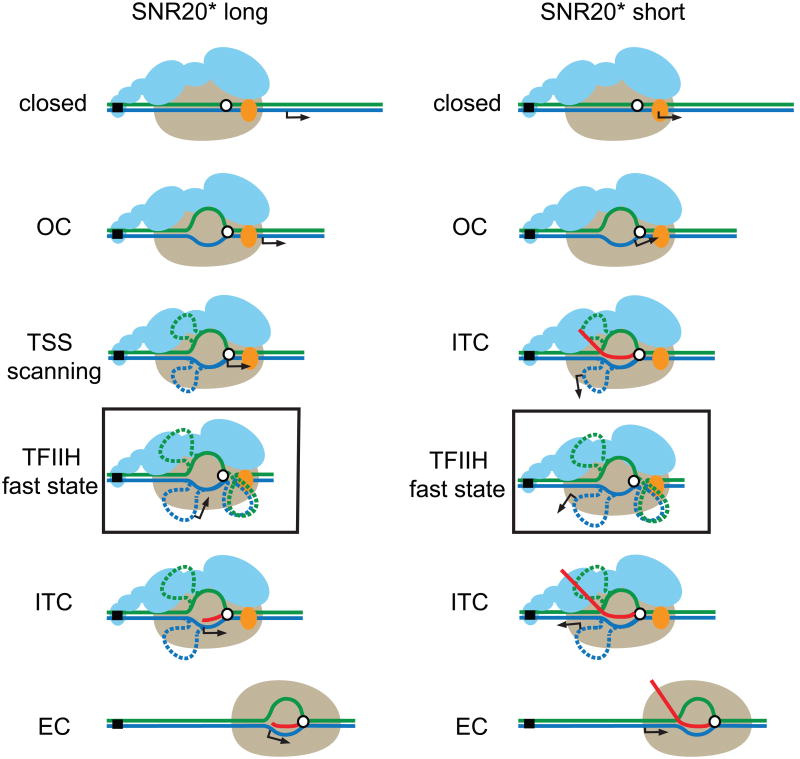
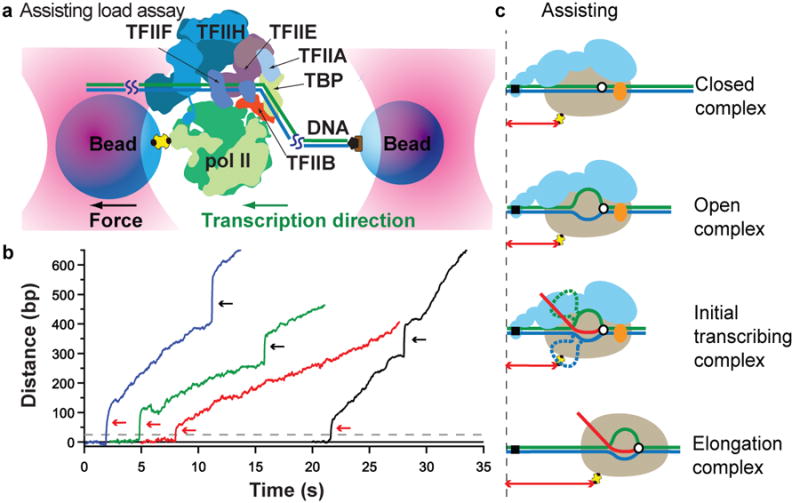
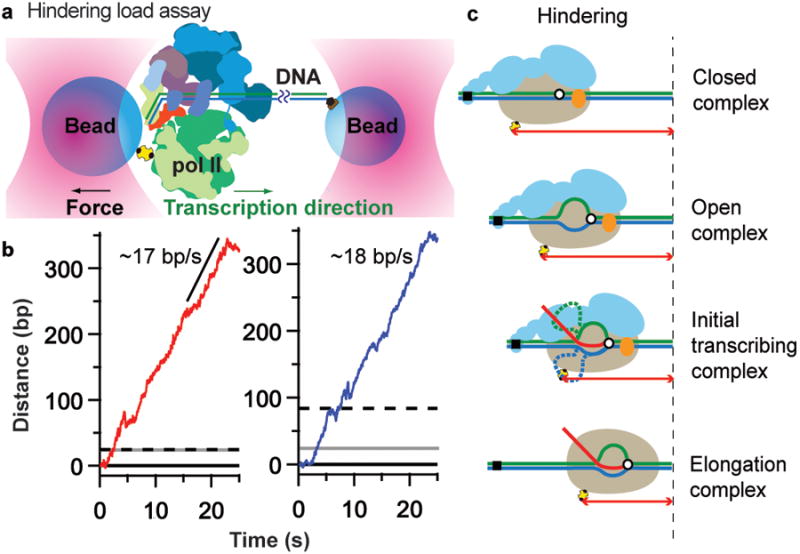
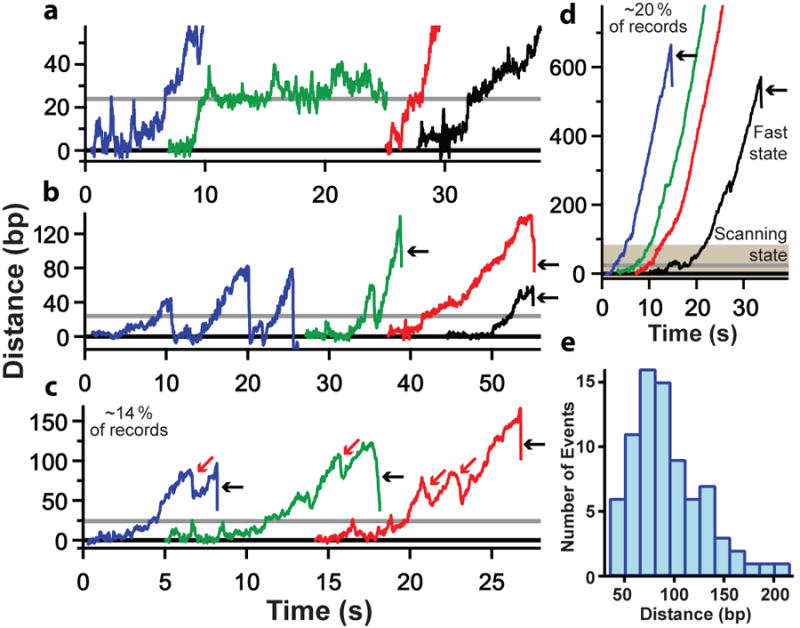
Biochemical and structural studies have shown that the initiation of RNA polymerase II transcription proceeds in the following stages: assembly of the polymerase with general transcription factors and promoter DNA in a 'closed' preinitiation complex (PIC); unwinding of about 15 base pairs of the promoter DNA to form an 'open' complex; scanning downstream to a transcription start site; synthesis of a short transcript, thought to be about 10 nucleotides long; and promoter escape. Here we have assembled a 32-protein, 1.5-megadalton PIC derived from Saccharomyces cerevisiae, and observe subsequent initiation processes in real time with optical tweezers. Contrary to expectation, scanning driven by the transcription factor IIH involved the rapid opening of an extended transcription bubble, averaging 85 base pairs, accompanied by the synthesis of a transcript up to the entire length of the extended bubble, followed by promoter escape. PICs that failed to achieve promoter escape nevertheless formed open complexes and extended bubbles, which collapsed back to closed or open complexes, resulting in repeated futile scanning.


Figures

Extended Figure 1
Extended Figure 1. 29-component PIC assembled on SNR20* short promoter
(a) PIC excluding the kinase domain (TFIIK) was assembled on SNR20* short (adjacent to the 2.7-kbp downstream handle sequence) and sedimented on a glycerol gradient; fractions were analyzed by SDS-PAGE. (b) The results from fraction 12, annotated in detail, indicate that all PIC components were retained, confirming that the complex reconstituted fully from the component proteins. The subunit(s) of pol II are labeled in black, TFIIF in blue, TFIIE in magenta, TFIIH in orange, TFIIA in cyan, TFIIB in red, TBP in light green, and Sub1 in dark green. TFIIK (3-subunits) was later added to the PIC.
Extended Figure 2
Extended Figure 2. Schematic diagram showing assembly of dumbbells
PICs were attached to one bead via biotin-avidin linkages (yellow). To form dumbbell tethers, the other end of a small fraction of the PICs (4%) had digoxigenin linkages that could be tethered to anti-digoxigenin-coated beads (black and brown) via a 2.7 kb DNA handle. PICs not involved in tether formation served to increase the local concentration of PIC components.
Extended Figure 3
Extended Figure 3. Run-off transcription under single-molecule assay conditions
(a) 0.1 pmol of the isolated PIC formed on the SNR20* fragment (−62/+636) fused to the 2.7kbp DNA handle was transcribed in the presence of increasing amount of PICs assembled on the same promoter SNR20* (−62/+96) without handle. The SNR20* fragment fused to the DNA handle failed to support transcription (lane 1), but the transcription activity was restored (red arrow) when PICs without handle were supplemented into the mix (lanes 2–5). Run-off transcription from the SNR20* promoter without handle is indicated (black arrow). We adopted a 25:1 ratio of PICs assembled on SNR20* without handles to PICs assembled on SNR20* with handles for the single-molecule study. (b) 1.5 pmol of PIC formed on the SNR20* fragment (−62/+96) was transcribed at the concentrations indicated above each lane. As the concentration of PIC was reduced from 37 nM to 4.5 nM, the transcription efficiency (run-off band, black) decreased from ∼18% to 2-3%. The extremely low concentrations employed in single-molecule assays (<1 nM) could not be directly examined on such gels, but we expect that transcription efficiencies remained correspondingly low.
Extended Figure 4
Extended Figure 4. Records of TFIIH scanning on SNR20* long with rNTPs or dATP
Just as for SNR20* short (Fig. 4), the longer promoter shows TFIIH scanning with both rNTPs (a) or dATP only (b), after which either the PIC dissociates (black arrows), or the bubble collapses to the closed (blue and green records) or open complex (grey line) and TFIIH moves again. The dashed line indicates the position of the TSS (+1).
Extended Figure 5
Extended Figure 5. Exonuclease III footprinting assay of the PIC on SNR20* long
In the absence of nucleotides in vitro, PIC complexes bound to the SNR20* long promoter produced barriers to exonuclease III digestion located ∼50 bp downstream of the TATA box (about −40 nt from the TSS, black arrows). These barriers depended on the presence of TFIIH and also TFIIE, which interacts with TFIIH. Upon the addition of dATP, the barriers disappeared, and the bands at pause positions were intensified between positions −30 and +30 (∼60–120 bp downstream of the TATA box, bracket).
Extended Figure 6
Extended Figure 6. The transcription initiation pathway for SNR20* long (left panel) and SNR20* short promoters (right panel)
A model for the initiation pathway on the SNR20* long promoter. Left panel, with states starting from the top: Pol II (beige) with attached GTFs (blue) and ssl2 (orange) binds in its “closed” form to the promoter element upstream of the TSS (arrow) on the DNA template (green and blue lines). Positions of the enzyme active site (open white circle) and TATA box (closed black square) are indicated. Unwinding by TFIIH produces an open complex (OC) that leads to bubble formation. Arrival of the OC at the TSS due to scanning, driven by TFIIH, leads to the formation of an extended bubble (dashed lines indicate the speculative position of ssDNA. If the complex fails to recognize the TSS, it can be driven beyond it by TFIIH, resulting in a “fast state” that produces no RNA but advances at roughly twice the normal rate (black box; see text). When Pol II recognizes the TSS, it begins transcription of RNA (red line), corresponding to the initial transcription complex (ITC). Formation of the ITC leads to bubble collapse, followed by the loss of GTFs and transition to the elongation complex (EC). Corresponding model for the initiation pathway on the SNR20* short promoter. Right panel, with states starting from the top: Similar states as for SNR20* long. In this case, the OC does not need to scan for the TSS, which is found within its DNA footprint. As a consequence, the ITC can form and begin RNA synthesis once the active site has recognized the TSS. A longer segment of RNA can thereby be produced prior to the transition to the EC.
Figure 1
Figure 1. Transcription initiation in assisting-load assay
(a) A dumbbell tether (not to scale) is formed between beads (blue) held in separate optical tweezers (pink), with one attached to pol II (green) in the PIC via an avidin-biotin linkage (yellow, black), and the other to upstream DNA via a digoxigenin linkage (brown, black). As transcription proceeds (green arrow indicates direction), the tether extension increases. (b) Representative records of pol II elongation (dashed grey line denotes the TSS location) after promoter escape (red arrows), with the applied force often stepped up after ∼10 s to confirm elongation (black arrows; the associated vertical discontinuity is due to tether stretch). (c) Ssl2 (orange) unwinds the template (blue) and non-template (green) strands of DNA around the active site (white circle, black outline) of pol II (beige) and creates a transcription bubble (OC formation). RNA synthesis while still bound to the promoter results in DNA scrunching at the upstream edge of transcription bubble (ITC), which re-anneals after pol II enters productive elongation (EC). Distances measured by the assays are indicated (double-headed red arrows). Not to scale.
Figure 2
Figure 2. Transcription initiation in hindering-load assay
(a) By attaching one bead to downstream DNA, a hindering-load assay was developed (not to scale, Sub1 not shown). Scanning and subsequent transcription events (green arrow indicates transcription direction) resulted in tether-extension decrease. (b) Records illustrating pol II escape and elongation, with a velocity of ∼17–18 bp/s, collected on SNR20* short (red, left panel) and SNR20* long (blue, right panel) in the presence of rNTPs. The dashed black line denotes the TSS at +1; the solid grey line marks position of the predicted ∼24 bp distance change upon OC formation. (c) Distances measured by the assays are indicated (color scheme same as Fig. 1c).
Figure 3
Figure 3. Records of TFIIH motion for the SNR20* short construct with rNTPs present in hindering-load assay
(a) Initial transition from the closed (0 bp) to open complex (∼24 bp predicted distance change, grey line). (b) Scanning behavior, with occasional bubble collapse to the closed complex (blue record) or open complex (green record). (c) Infrequent slips in the records were observed (red arrows) (d) Occasional irreversible transition from scanning (shaded region) to a highly-processive fast state, occurring at a distance of 130 ± 21 bp (N = 9, mean ± S.E.M.). In all records, black arrows mark tether breakage, likely due to PIC dissociation. (e) Histogram of TFIIH processivity, with a peak between 40 bp and 140 bp (N = 78).

References

    1. Conaway RC, Conaway JW. General initiation factors for RNA polymerase II. Annu Rev Biochem. 1993;62:161–190. - PubMed
    1. Kornberg RD. The molecular basis of eukaryotic transcription. Proc Natl Acad Sci U S A. 2007;104:12955–12961. - PMC - PubMed
    1. Holstege FC, Fiedler U, Timmers HT. Three transitions in the RNA polymerase II transcription complex during initiation. EMBO J. 1997;16:7468–7480. - PMC - PubMed
    1. Pal M, Ponticelli AS, Luse DS. The role of the transcription bubble and TFIIB in promoter clearance by RNA polymerase II. Mol Cell. 2005;19:101–110. - PubMed
    1. Murakami K, et al. Formation and Fate of a Complete, 31-Protein, RNA polymerase II Transcription Initiation Complex. J Biol Chem. 2013 - PMC - PubMed

Publication types

MeSH terms