. 2015 Sep 17;525(7569):384-8.
doi: 10.1038/nature14985. Epub 2015 Sep 2.

The spliceosome is a therapeutic vulnerability in MYC-driven cancer

Affiliations

The spliceosome is a therapeutic vulnerability in MYC-driven cancer

Tiffany Y-T Hsu et al. Nature. .

Abstract

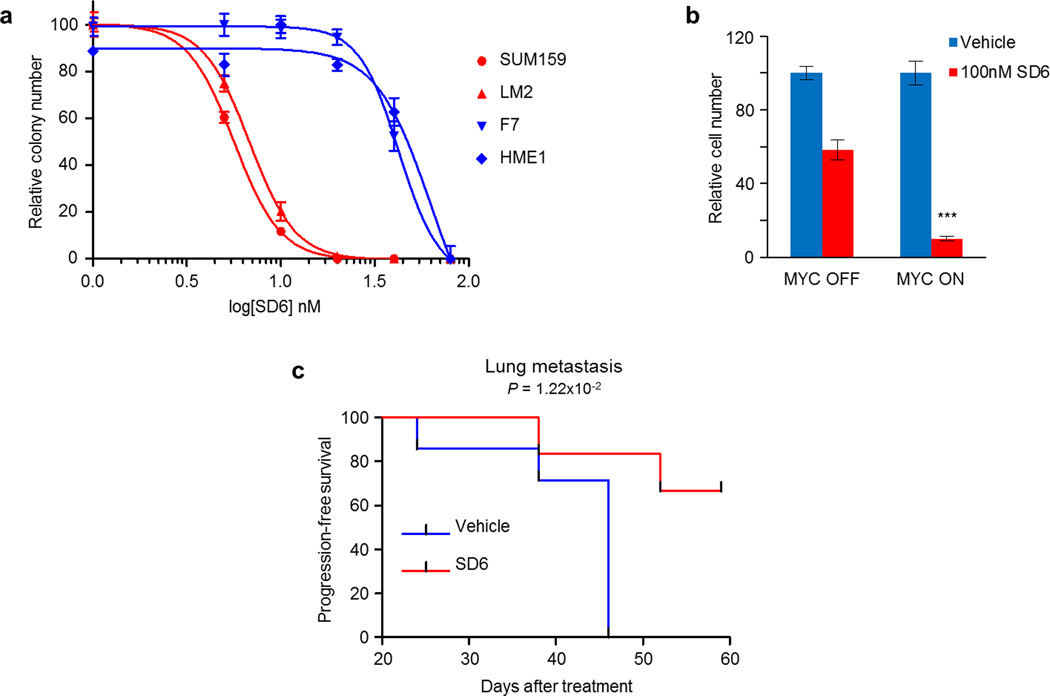
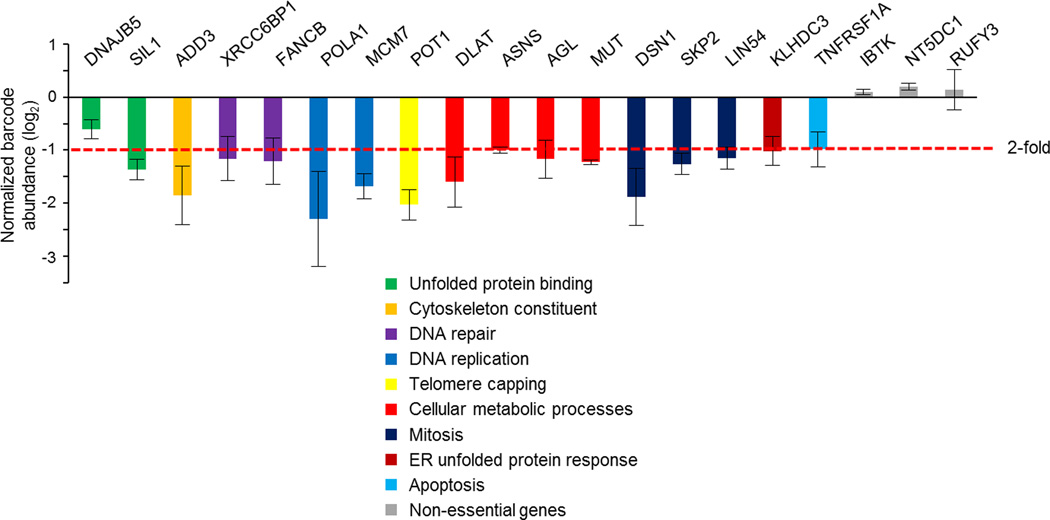
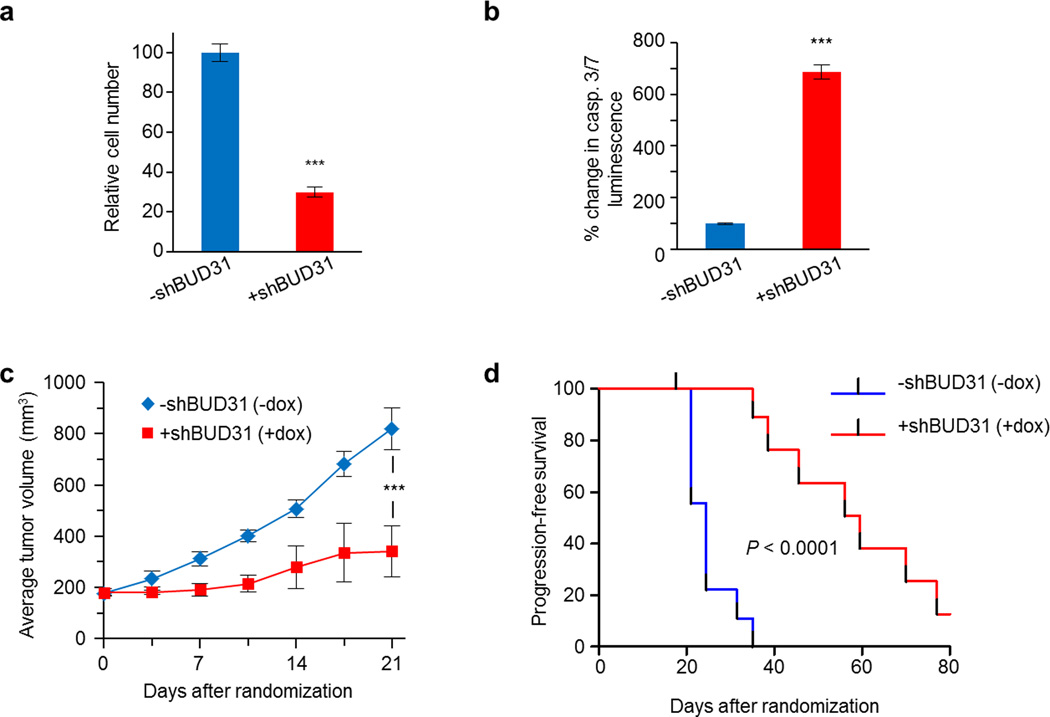
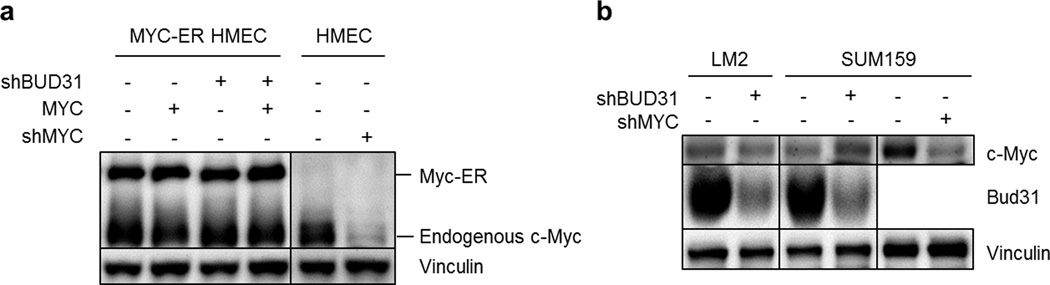
MYC (also known as c-MYC) overexpression or hyperactivation is one of the most common drivers of human cancer. Despite intensive study, the MYC oncogene remains recalcitrant to therapeutic inhibition. MYC is a transcription factor, and many of its pro-tumorigenic functions have been attributed to its ability to regulate gene expression programs. Notably, oncogenic MYC activation has also been shown to increase total RNA and protein production in many tissue and disease contexts. While such increases in RNA and protein production may endow cancer cells with pro-tumour hallmarks, this increase in synthesis may also generate new or heightened burden on MYC-driven cancer cells to process these macromolecules properly. Here we discover that the spliceosome is a new target of oncogenic stress in MYC-driven cancers. We identify BUD31 as a MYC-synthetic lethal gene in human mammary epithelial cells, and demonstrate that BUD31 is a component of the core spliceosome required for its assembly and catalytic activity. Core spliceosomal factors (such as SF3B1 and U2AF1) associated with BUD31 are also required to tolerate oncogenic MYC. Notably, MYC hyperactivation induces an increase in total precursor messenger RNA synthesis, suggesting an increased burden on the core spliceosome to process pre-mRNA. In contrast to normal cells, partial inhibition of the spliceosome in MYC-hyperactivated cells leads to global intron retention, widespread defects in pre-mRNA maturation, and deregulation of many essential cell processes. Notably, genetic or pharmacological inhibition of the spliceosome in vivo impairs survival, tumorigenicity and metastatic proclivity of MYC-dependent breast cancers. Collectively, these data suggest that oncogenic MYC confers a collateral stress on splicing, and that components of the spliceosome may be therapeutic entry points for aggressive MYC-driven cancers.


Figures

Extended Data Figure 1
Extended Data Figure 1. Validation of BUD31 as a MYC-synthetic lethal gene in HMECs
a, qRT-PCR analysis of BUD31 mRNA level (mean±s.d., n=3 biological replicates). b, Clonogenicity of MYC-ER HMECs with or without MYC hyperactivation or BUD31 depletion (mean±s.e.m., n=4 biological replicates, **P<0.01, two-tailed Student’s t-test). c, Caspase-3/7 activation by caspase luminescence assay (mean±s.e.m., n=3, ***P<0.001, one-way ANOVA). d, FLAG-tagged protein levels in MYC-ER HMECs in which vinculin was used as a loading control.
Extended Data Figure 2
Extended Data Figure 2. BUD31 interacts with core spliceosomal factors and is required for spliceosomal assembly and pre-mRNA splicing
a, 134 core spliceosomal proteins are listed. Proteins in red are shown to interact with BUD31, as discovered by Flag-BUD31 IP-MS and BUD31 bimolecular fluorescence complementation (BiFC). b, Heat map of BUD31-interacting spliceosomal proteins, organized by spliceosome sub-complexes. A black-green color scale depicts normalized BiFC interaction values between spliceosomal proteins and negative control protein (technical replicates in 2 left lanes) and BUD31 (technical replicates in 2 right lanes). c, Spliceosomal snRNPs (colored circles) interact in a stepwise manner to excise intronic sequences from pre-mRNA. snRNPs with proteins identified from the BUD31 IP-MS are noted (blue outline) to be BUD31-associated. d, Co-immunoprecipitation of Flag-BUD31 for non-spliceosomal proteins. Input and IP blots probed by EIF2S1 and EIF3I were taken at different exposures to minimize background signal. e, Interaction between N-YFP-tagged BUD31 and C-YFP-tagged spliceosomal (DDX46) or cytoplasmic proteins (TRIM9, SOCS2, EPHA8) was assessed by cellular fluorescence (mean±s.e.m., n=3 technical replicates). f, Nuclear extracts with or without BUD31 knockdown were incubated with pre-mRNA substrate, and RT-PCR of unspliced RNA (top) and spliced RNA (bottom) was performed, using primers at the indicated arrows (left). BUD31 protein levels in the nuclear extracts were normalized to vinculin expression (middle) and quantified (right). g, Radioactively labeled pre-mRNA (MINX) was incubated with nuclear extracts with or without BUD31 depletion. RNA purified from the splicing reaction was run on a denaturing gel and imaged by autoradiography. The identities of prominent bands are based on size. * denotes putative intron-lariat band. h, After in vitro splicing was performed as described previously, products were electrophoresed on native gel, and spliceosome complexes were visualized by autoradiography. Complex A and non-specific H complexes are labeled. i, Phosphorimager quantification of the ratio of RNA in complex A compared to that in complex H. j, Interaction between N-YFP-tagged wild-type (WT) or mutant BUD31 and C-YFP-tagged splicing factors was assessed by cellular fluorescence (mean±s.e.m., n=2 technical replicates, ***P<0.001, two-tailed Student’s t-test).
Extended Data Figure 3
Extended Data Figure 3. HMECs with oncogenic activation of HER2 and EGFR do not require BUD31
a, Cell number changes in HMECs with inducible shBUD31 and constitutive HER2 or EGFR expression (mean±s.e.m.; n=4 technical replicates; *P<0.05; N.S., not statistically significant; two-tailed Student’s t-test). HER2 and EGFR protein is normalized to vinculin (right). b, MYC protein levels in HMECs with constitutive HER2 or EGFR expression. c, MYC induction by tamoxifen in MYC-ER HMECs does not increase cell proliferation over time (mean±s.e.m., n=8 technical replicates).
Extended Data Figure 4
Extended Data Figure 4. Partial knockdown of core splicing factors is MYC-synthetic lethal in HMECs
a–d, mRNA levels for core splicing factors (a) SF3B1, (b) U2AF1, (c) EFTUD2, and (d) SNRPF were evaluated by qRT-PCR (mean ±s.d., n=3 technical replicates). e–i, Caspase-3/7 luminescence in MYC-ER HMECs with (e–h) partial suppression of core spliceosomal proteins or (i) spliceosome inhibitor SD6 (mean±s.e.m., n=3 technical replicates, ***P<0.001, one-way ANOVA).
Extended Data Figure 5
Extended Data Figure 5. BUD31 loss in MYC-hyperactivated cells destabilizes mRNA
a–b, MYC-ER HMECs with inducible shBUD31 treated with actinomycin D for 5 hours were labeled with oligo(dT)25 LNA probes via fluorescence in situ hybridization. Cellular FITC intensity was assessed within (a) cellular and (b) nuclear regions (DAPI+). Data are represented as the difference in cellular FITC intensity between 0 hour and 5 hours of actinomycin D treatment in each cell state (mean±s.e.m., n=150, ***P<0.001, two-tailed Student’s t-test).
Extended Data Figure 6
Extended Data Figure 6. BUD31 depletion in MYC-hyperactivated cells enhances intron retention and decreases expression of cell-essential genes
In MYC-hyperactive cells, 17 representative genes display increased intron retention and decreased steady-state RNA levels after BUD31 knockdown. Depletion of these genes by shRNA decreased cell viability (mean barcode abundance±s.e.m.). 2-fold decrease in barcode abundance is noted by the dashed red line. All values are reflective of 3 biological replicates, and genes are color-coded based on their GO-term annotation.
Extended Data Figure 7
Extended Data Figure 7. MYC-dependent breast cancer cells require BUD31 for in vitro and in vivo growth
a, Relative cell number of SUM159 cells with doxycycline-inducible shBUD31 in vitro (mean±s.e.m., n=8 technical replicates, ***P<0.001, two-tailed Student’s t-test). b, Caspase-3/7 luminescence in BUD31-depleted SUM159 cells (mean±s.e.m., n=3 technical replicates, ***P<0.001, two-tailed Student’s t-test). c–d, SUM159 cells engineered with dox-inducible shBUD31 were subcutaneously transplanted into mice and randomized onto dox treatment (−dox n=10, +dox n=9). Loss of BUD31 SUM159 xenografts (c) inhibits tumor growth (mean±s.e.m., *** P<0.001 at day 21, two-tailed Student’s t-test) and (d) prolongs progression-free survival in nude mice (P-value, log-rank test).
Extended Data Figure 8
Extended Data Figure 8. BUD31 depletion does not affect levels of MYC protein
a, MYC protein levels in MYC-ER HMECs with inducible shBUD31 expression normalized to vinculin expression. To confirm specificity of MYC antibody, human mammary epithelial cells without the MYC-ER construct (HMEC) were engineered to express inducible shMYC. b, MYC protein levels in SUM159 and LM2 cells with inducible shBUD31 normalized to vinculin expression. To confirm specificity of MYC antibody, SUM159 cells were engineered to express inducible shMYC.
Extended Data Figure 9
Extended Data Figure 9. Core splicing factors EFTUD2 and SNRPF are required for MYC-dependent LM2 breast cancer tumor growth
Schematic for in vivo barcode-based competition assay. LM2 cells transduced with inducible shRNAs targeting negative control genes or candidate genes were mixed at an equal ratio. This mixed population was transplanted into mice, and tumors were allowed to form in the presence or absence of dox. At the experimental endpoint, genomic DNA was isolated for comparisons of relative barcode (shRNA) abundance in tumor genomic DNA.
Extended Data Figure 10
Extended Data Figure 10. Spliceosome inhibitor SD6 inhibits MYC-dependent cancer cells in vitro and in vivo
a, MYC-dependent breast cancer cells (SUM159, LM2) and MYC-normal immortalized epithelial cells (F7, HME1) were cultured with SD6 at low density and analyzed for clonogenic growth. b, MYC-repressible human B-cell line P493-6 was treated with or without 100 nM SD6 in the absence or presence of MYC-hyperactivation for four days, and cells were counted for relative cell number changes (mean±s.e.m., n=3 biological replicates, ***P<0.001, one-way ANOVA). c, Kaplan-Meier survival analysis of nude mice with pulmonary seeding of LM2 cells treated with or without SD6 for 10 days (vehicle n=7, SD6 n=6, P-value by log-rank test).
Figure 1
Figure 1. The spliceosome is required for cells to tolerate oncogenic MYC hyperactivation
a, BUD31 is a MYC-synthetic lethal gene. b, shBUD31 barcode abundances +/−MYC-ER hyperactivation (mean±s.e.m., n=3 biological replicates). c, Relative number of MYC-ER HMECs with dox-inducible shBUD31-UTR and constitutive Flag-GFP or -BUD31 expression (mean±s.e.m., n=4 technical replicates). d, Flag-BUD31 co-immunoprecipitation for core spliceosomal factors. e, Interaction between BUD31 and spliceosomal proteins assessed by BiFC (mean±s.e.m., n=3 technical replicates). f, GFP+ MYC-dependent cells with inducible shBUD31-UTR and constitutive WT, mutant BUD31, or negative control cDNA expression were mixed with GFP cells and passaged (mean±s.e.m, n=8 technical replicates, two-tailed Student’s t-test). g, Change in MYC-ER HMEC clonogenicity after SD6 treatment (mean±s.e.m., n=4 technical replicates, two-tailed Student’s t-test). h–k, Relative number of MYC-ER HMECs after partial depletion of core spliceosomal proteins (mean±s.e.m., n=4 technical replicates, one-way ANOVA). **P<0.01, ***P<0.001.
Figure 2
Figure 2. In MYC-hyperactivated cells, perturbation of the spliceosome leads to global intron retention
a, (Left) total poly(A)+ RNA per cell (10−4 ng) and (right) newly synthesized 4-sU-labeled poly(A)+ RNA per cell (10−5 ng) (mean±s.e.m., n=4 technical replicates for both assays, two-tailed Student’s t-test). b, Schematic of intron retention (IR) analysis. c–d, Empirical cumulative distribution of IR coefficients for (c) 75,623 exon-intron junctions or (d) 6,861 genes. Curves represent IR differences after BUD31 depletion in MYC-normal and MYC-hyperactive states. A rightward shift in the MYC-hyperactive curve indicates increased IR (Kolmogorov-Smirnov test). e–g, Log2-fold changes in junction IR relative to untreated by RNAseq of representative genes (mean±s.e.m., n=3 biological replicates, two-tailed Student’s t-test). h–j, qRT-PCR validation showing fold change in junction IR relative to untreated (mean±s.d., n=3 biological replicates, two-tailed Student’s t-test). *P<0.05, **P<0.01, ***P<0.001
Figure 3
Figure 3. Combined spliceosomal perturbation and MYC-hyperactivation inhibits pre-mRNA maturation
a, Model of MYC-spliceosome synthetic lethality. b, Difference in cellular poly(A)+ RNA in HMECs after actinomycin D (A.D.) treatment (mean±s.e.m., n=3 biological replicates, two-tailed Student’s t-test). c, Steady-state poly(A)+ RNA levels per cell (10−4 ng) (mean±s.e.m., n=4 biological replicates, two-tailed Student’s t-test). d, Gene ontology (GO) enrichment of intron-retained genes in the MYC-hyperactive and BUD31-depleted state. Dashed line indicates P=0.05. e–f, In MYC-hyperactive BUD31-shRNA cells, representative genes display (e) increased intron retention (mean±s.e.m.) and (f) decreased steady-state RNA levels (mean±s.e.m.) after BUD31 knockdown in MYC-hyperactivated cells. Bar colors represent GO terms, see legend in Extended Data Figure 6. **P<0.01, ***P<0.001
Figure 4
Figure 4. In vivo perturbation of spliceosomal activity impairs MYC-dependent breast tumors and metastases
a, Schematic for identifying genetic co-dependencies in breast cancer lines. b–c, MYC-siMEM score, which represents the correlation between cell line sensitivity to MYC-shRNAs and sensitivity to shRNAs targeting random gene sets (n=100,000), is plotted against frequency of gene sets. Increasing MYC-siMEM values denote higher correlation with MYC-dependency. Red arrows indicate MYC-siMEM scores for spliceosome-dependency in (b) all breast cancer lines (n=72) and (c) the basal breast cancer subset (n=32, P-value by bootstrap analysis for both). d–e, MDA-MB-231-LM2 cells with shBUD31 display (d, bottom) diminished BUD31 protein levels, (d, top) decreased cell numbers (mean±s.e.m., n=8 technical replicates, two-tailed Student’s t-test) and (e) increased caspase-3 cleavage (bottom) and caspase-3/7 luminescence (top; mean±s.e.m., n=3 technical replicates, two-tailed Student’s t-test). f–g, Barcode-shRNA abundance of LM2 cells within (f) primary tumors or (g) pulmonary metastases. Mean barcode abundance in each tumor or lung is normalized to the injected cell population (n=3 technical replicates, two-tailed Student’s t-test). h, Change in LM2 tumor growth after 2 weeks of vehicle (n=13) or SD6 (n=10) infusion. Bars indicate mean values (two-tailed Student’s t-test). i, Pulmonary LM2 bioluminescence after 10-day infusion with vehicle (n=7) or SD6 (n=6). Bars indicate median values (Mann-Whitney test). *P<0.05, **P<0.01, ***P<0.001.

Comment in

References

    1. Eilers M, Eisenman RN. Myc's broad reach. Genes & development. 2008;22:2755–2766. - PMC - PubMed
    1. Sabo A, Amati B. Genome recognition by MYC. Cold Spring Harbor perspectives in medicine. 2014;4 - PMC - PubMed
    1. Dang CV. MYC, metabolism, cell growth, and tumorigenesis. Cold Spring Harbor perspectives in medicine. 2013;3 - PMC - PubMed
    1. Lin CY, et al. Transcriptional amplification in tumor cells with elevated c-Myc. Cell. 2012;151:56–67. - PMC - PubMed
    1. Nie Z, et al. c-Myc is a universal amplifier of expressed genes in lymphocytes and embryonic stem cells. Cell. 2012;151:68–79. - PMC - PubMed

Publication types

MeSH terms

Associated data