Comparative Study
. 2015 Sep 10;525(7568):256-60.
doi: 10.1038/nature14897. Epub 2015 Sep 2.

Distinct EMT programs control normal mammary stem cells and tumour-initiating cells

Affiliations
Comparative Study

Distinct EMT programs control normal mammary stem cells and tumour-initiating cells

Xin Ye et al. Nature. .

Abstract

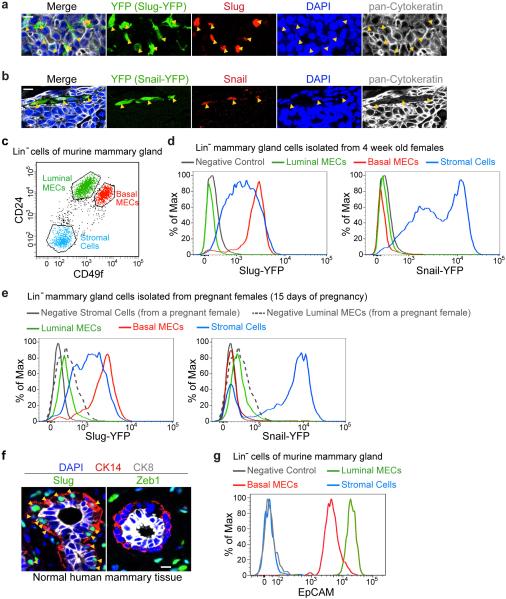
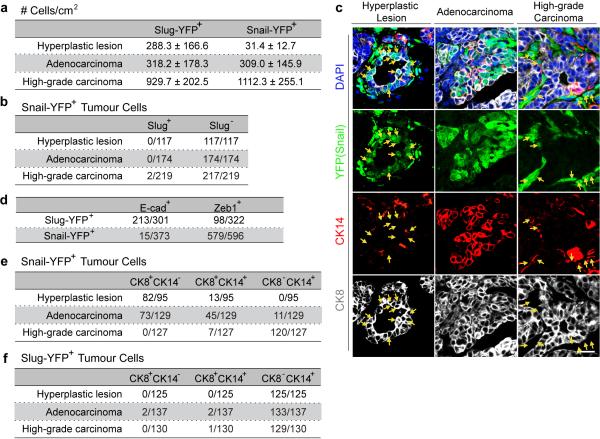
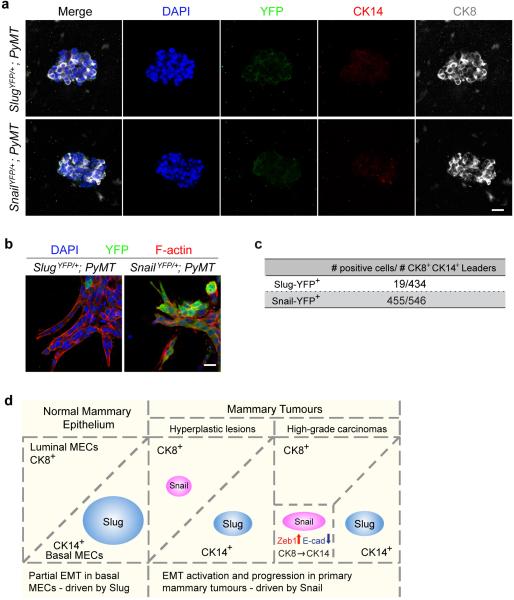
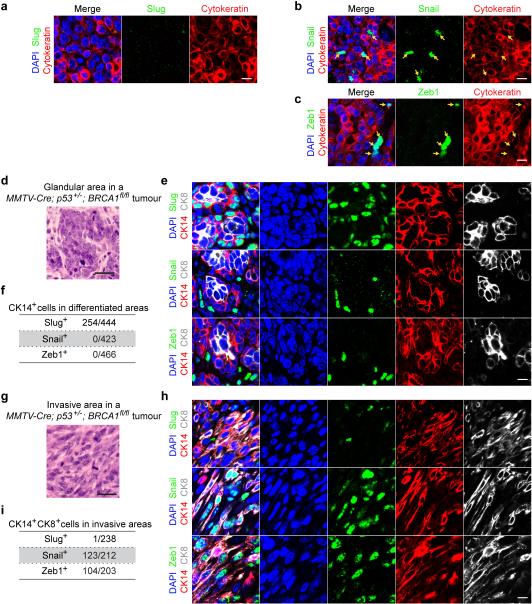
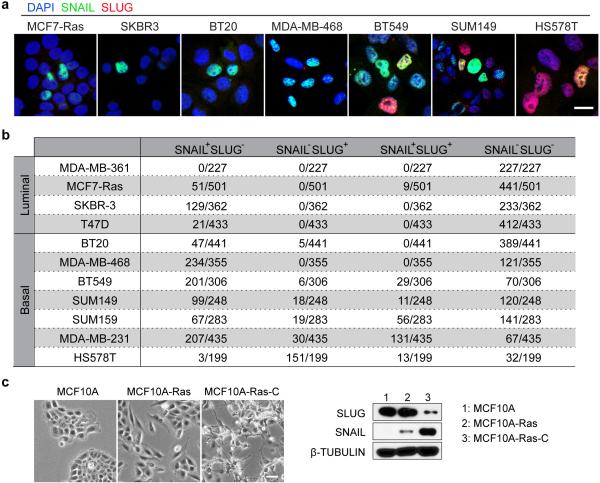
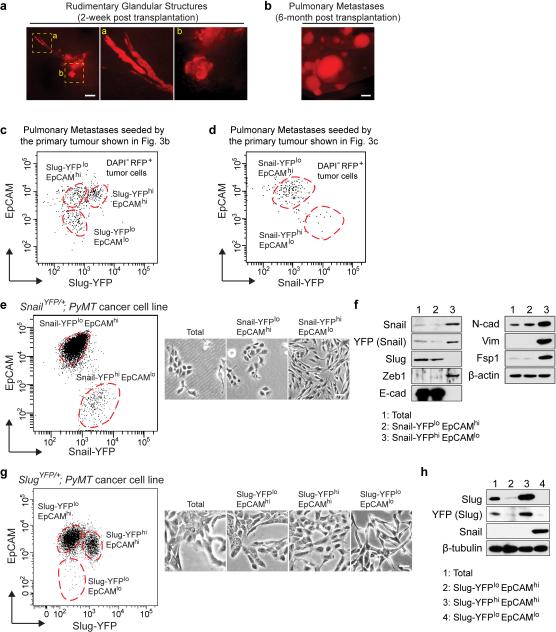
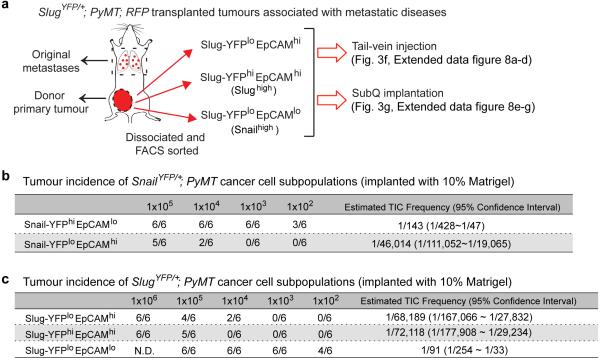
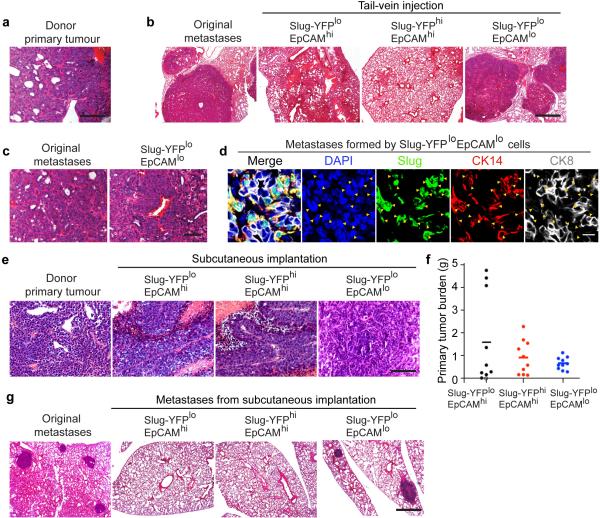
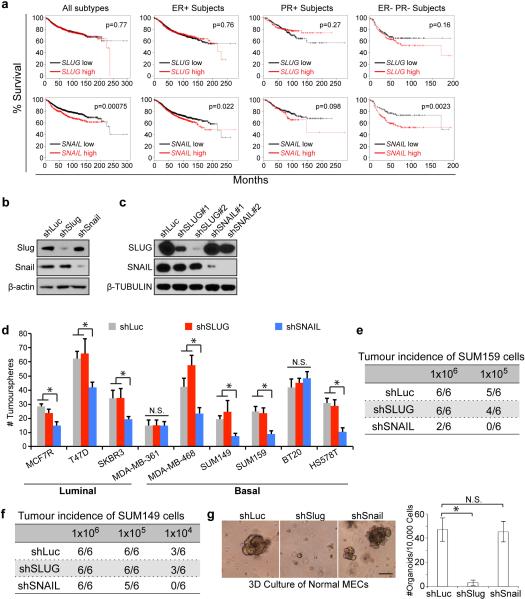
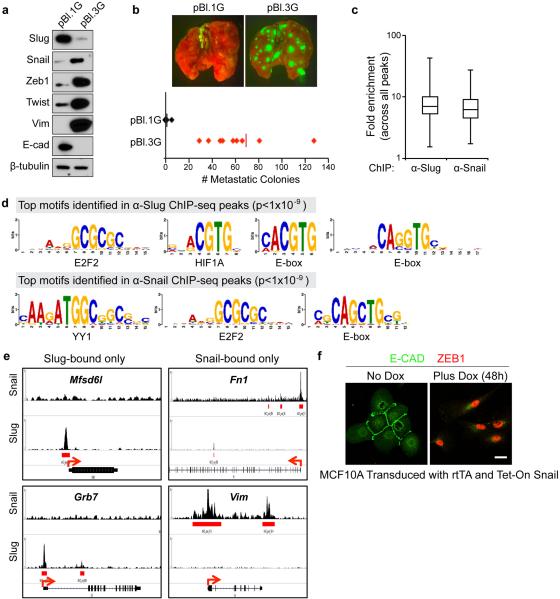
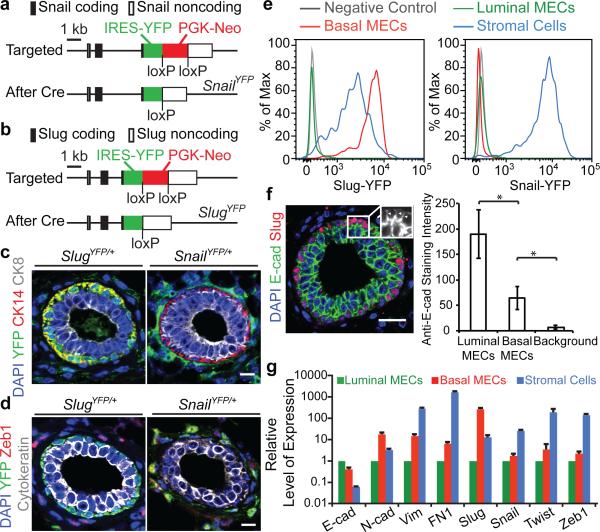
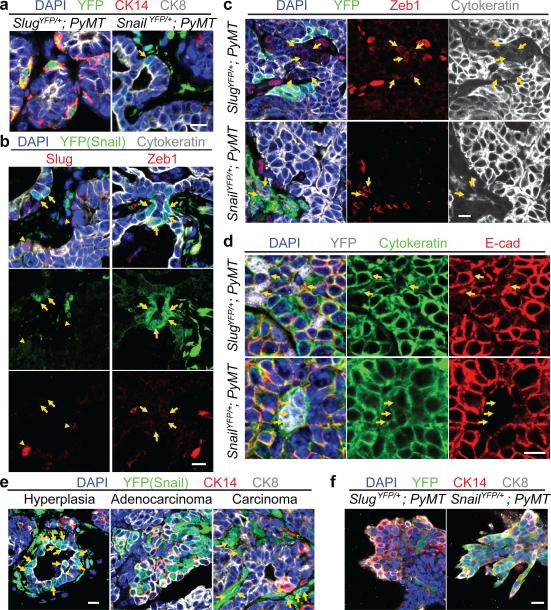
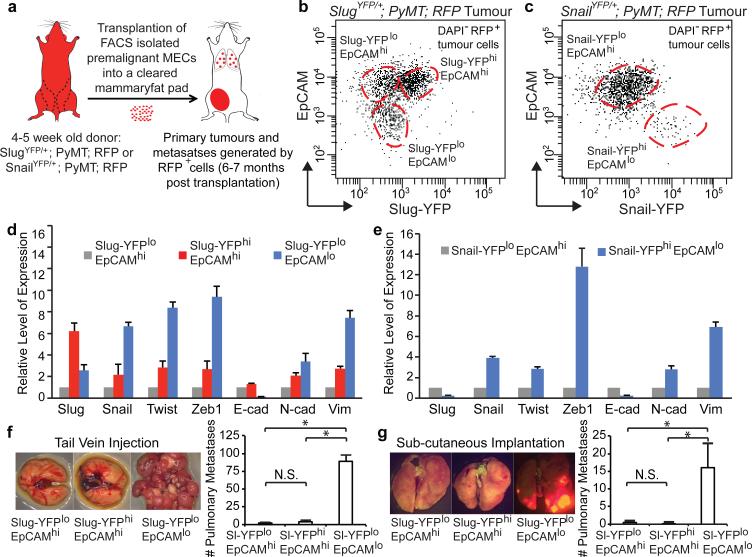
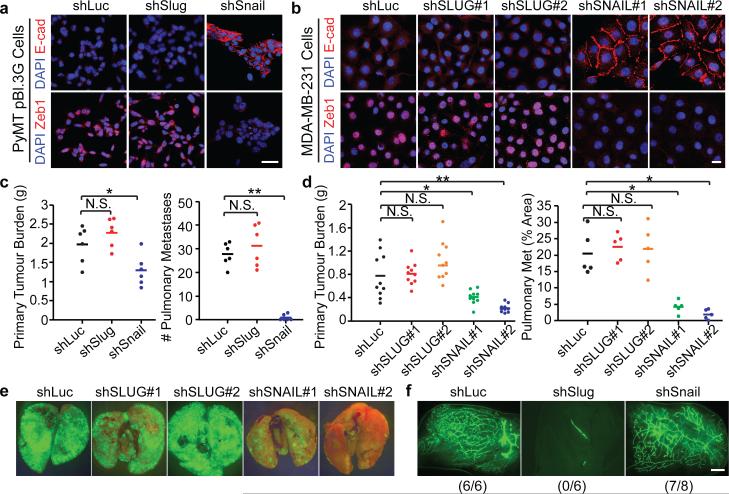
Tumour-initiating cells (TICs) are responsible for metastatic dissemination and clinical relapse in a variety of cancers. Analogies between TICs and normal tissue stem cells have led to the proposal that activation of the normal stem-cell program within a tissue serves as the major mechanism for generating TICs. Supporting this notion, we and others previously established that the Slug epithelial-to-mesenchymal transition-inducing transcription factor (EMT-TF), a member of the Snail family, serves as a master regulator of the gland-reconstituting activity of normal mammary stem cells, and that forced expression of Slug in collaboration with Sox9 in breast cancer cells can efficiently induce entrance into the TIC state. However, these earlier studies focused on xenograft models with cultured cell lines and involved ectopic expression of EMT-TFs, often at non-physiological levels. Using genetically engineered knock-in reporter mouse lines, here we show that normal gland-reconstituting mammary stem cells residing in the basal layer of the mammary epithelium and breast TICs originating in the luminal layer exploit the paralogous EMT-TFs Slug and Snail, respectively, which induce distinct EMT programs. Broadly, our findings suggest that the seemingly similar stem-cell programs operating in TICs and normal stem cells of the corresponding normal tissue are likely to differ significantly in their details.


Figures

Extended data figure 1
Extended data figure 1. Slug expression is associated with a partial EMT phenotype in normal MECs
(a) Validation of the Slug-YFP knock-in reporter. Mammary tumour section from SlugYFP/+;MMTV-PyMT female mice were stained for YFP (green), Slug (red), cytokeratin (grey), and DAPI (blue). (b) Validation of the Snail-YFP knock-in reporter. Mammary tumour section from SnailYFP/+;MMTV-PyMT female mice were stained for YFP (green), Snail (red), cytokeratin (grey), and DAPI (blue). (c) Lin cells of normal mammary glands were separated into luminal MECs, basal MECs and stromal fibroblasts using CD24 and CD49f cell-surface markers.(d, e) Representative FACS histogram showing relative expression levels of Slug-YFP and Snail-YFP reporters in the indicated cell populations in mammary glands during puberty (d) and during pregnancy (e). Note that luminal MECs from pregnant females exhibit higher levels of autofluorescence signals (grey dashed line in panel e). (f) Normal human mammary tissue sections were stained for Slug or Zeb1 (green), CK14 (red), CK8 (grey), and DAPI (blue). Arrowheads indicate Slug+CK14+ cells. (g) Representative FACS histogram showing expression level of the epithelial cell-surface marker EpCAM in the indicated populations of the normal mammary gland. (d, e, g) are representative of three independent experiments. All scale bars 10 μm.
Extended data figure 2
Extended data figure 2. Differential expression of Snail and Slug in mammary tumours
(a, b) Quantifications of the frequencies of Slug-YFP+ and Snail-YFP+ tumour cells (a) and quantifications of Slug versus Snail expression (b) at different stages of mammary tumour development by immunofluorescence staining. For each stage, tumours from six animals were analyzed for the quantifications. (c) Individual channels of the stained image in Fig. 2e. (d) Quantifications of E-cad and Zeb1 positivity (n, number of cells, high-grade carcinomas from six animals were quantified). (e, f) Quantification of CK8 and CK14 expression profile of Snail-YFP-postive and Slug-YFP-positive tumour cells (n, number of cells). For each stage, tumours from six animals were analyzed for the quantifications. (b, d-f) n, number of cells.
Extended data figure 3
Extended data figure 3. Snail activation is associated with invasive changes in mammary tumour cells ex vivo
(a) Freshly isolated tumour organoids stained for YFP (green), CK14 (red), CK8 (grey), and DAPI (blue). Note only background staining was detected for YFP and CK14. Scale bar 20 μm. (b) Tumour organoids from animals of the indicated genotypes were cultured in type I collagen gel for 48h and stained for YFP (green), phalloidin (red), and DAPI (blue). Scale bar 10 μm. (c) Frequency of CK8+CK14+ leader cells expressing Slug-YFP and Snail-YFP (n, number of cells). Tumour organoids from five different animals were analyzed for each genotype. (d) Schematic diagram summarizing expression patterns of Snail and Slug in the normal mammary gland and at different stages of mammary tumour development in the MMTV-PyMT model.
Extended data figure 4
Extended data figure 4. Differential expression of Snail and Slug in MMTV-Neu and BRCA-1/p53-minus models of mammary tumours
(a-c) Representative immunofluorescence images of sections of aggressive MMTV-Neu tumours stained for DAPI (blue), Cytokeratin (red), and Slug (green, panel a)/Snail (green, panel b)/Zeb1 (green, panel c). Scale bar 10 μm. (d) H&E staining showing representative histology of differentiated area in MMTV-Cre;p53+/−;BRCA1fl/fl tumours. Scale bar 50 μm. (e) Representative immunofluorescence images of the differentiated areas in MMTV-Cre;p53+/−;BRCA1fl/fl tumours stained for the indicated proteins. Five tumours were analyzed, and quantifications are shown in (f) (n, number of cells). Scale bar 10 μm. (g) H&E staining showing representative histology of differentiated area in MMTV-Cre;p53+/−;BRCA1fl/fl tumours. Scale bar 50 μm. (h) Representative immunofluorescence images of the invasive areas in MMTV-Cre;p53+/−;BRCA1fl/fl tumours stained for the indicated proteins. Five tumours were analyzed, and quantifications are shown in (i) (n, number of cells).
Extended data figure 5
Extended data figure 5. Differential expression of Snail and Slug in human breast cancer cell lines
(a) Representative immunofluorescence images of indicated human breast cancer cell lines stained for DAPI (blue), SNAIL (green), and SLUG (red). Scale bar 10 μm. (b) Quantification of SLUG versus SNAIL expression in indicated human breast cancer cell lines (n, number of cells). Five fields were counted for each cell line. (c) Representative image showing the morphologies of the series of MCF10A cell lines in culture. Scale bar 50 μm. (d) Western Blot showing expression of SLUG and SNAIL in the indicated MCF10A cell lines. (a-d) represent two independent experiments. Uncropped western blots are enclosed in Supplemental Information.
Extended data figure 6
Extended data figure 6. Isolation of tumour cell subpopulations with differential Snail and Slug expression by FACS
(a, b) Representative wholemount images showing tumour progression in the transplantation model of mammary tumours illustrated in Fig. 3a. The implanted cells initially formed rudimentary gland-like structures (a) and eventually progressed to become high-grade carcinomas that spontaneously metastasize to the lungs. The RFP marker allows detection of pulmonary metastases as shown in (b). Scale bars 500 μm. Images represent five independent experiments. (c, d) FACS profiles of RFP+ tumour cells in the pulmonary metastases corresponding to the primary tumours shown in Fig. 3b and Fig. 3c. Major populations are outlined with dashed circles. (e) SnailYFP/+;MMTV-PyMT tumour cells were separated into indicated populations by FACS. The morphologies of the unfractionated cells and the purified populations are shown. Scale bar 50 μm. (f) Western blots showing expression of EMT markers in the indicated cell populations. (g) SlugYFP/+;MMTV-PyMT tumour cells were separated into indicated populations by FACS. The morphologies of the unfractionated cells and the purified populations are shown. Scale bar 50 μm. (h) Western blots showing expression of Slug, YFP and Snail in the indicated cell populations. Uncropped western blots are enclosed in Supplemental Information. (e-h) Data represent three independent experiments.
Extended data figure 7
Extended data figure 7. Fractionation of primary mammary tumours
(a) Experimental scheme for Fig. 3f, g, and extended data Fig. 8a-g. (b, c) Tumour cell subpopulations from SnailYFP/+;MMTV-PyMT tumour cell line (b) and SnailYFP/+;MMTV-PyMT tumour cell line (c) were injected subcutaneously at limiting dilutions to score primary tumour formation. Tumour-initiation cell frequencies were evaluated by ELDA. (b, c) Tumour-initiation were scored and presented as (# of tumour incidences/# of injections).
Extended data figure 8
Extended data figure 8. Breast TICs express Snail
(a) H&E staining showing the histology of the donor primary tumour where cells used in Fig. 3f were isolated from, scale bar 200 μm. (b) The original pulmonary metastases spawned by the primary tumour (left panel), and pulmonary metastases formed by the indicated tumour cell populations following tail-vein injection, scale bar 500 μm. (c) Higher magnification images of H&E stained lung sections showing histology of the original pulmonary metastases in the donor animal (left panel), and pulmonary metastases formed by the Slug-YFPloEpCAMlo tumour cells following tail-vein injection. Scale bar 200 μm. (d) Representative immunofluorescence staining image of sections of pulmonary metastases formed by the Slug-YFPloEpCAMlo tumour cells were stained for DAPI (blue), Slug (green), CK14 (red), and CK8 (grey). Arrowheads indicate Slug-positive cells. Scale bar 20 μm. Images represent four independent experiments. (e) H&E staining of the donor primary tumour where cells used in Fig. 3g were isolated from (left panel) and H&E staining of primary tumours formed by the indicated populations following subcutaneous implantation (with 25% Matrigel). (f) Primary tumour burdens formed by the indicated populations following subcutaneous implantation (For EpCAMloSluglo cells 1^104 cells were injected, for the other two groups 1^105 cells were injected. Primary tumours and lungs were analyzed 10-weeks post injection. n=10 sites of injections for each group). Open circle indicates failure of tumour-initiation. Scale bar 200 μm. Source Data are enclosed in Source Data T3. (g) H&E staining of lung sections showing metastatic outgrowths spawned by the indicated cell populations following subcutaneous implantation. Scale bar 500 μm.
Extended data figure 9
Extended data figure 9. Snail and Slug are differentially employed by normal MaSCs and breast TICs
(a) Kaplan-Meier plots showing survival of patients with the indicated subtypes of breast cancers. Patient groups were separated based on SLUG (top row) or SNAIL (bottom row) mRNA expression. (b) Western blot confirming Slug and Snail knockdown in established PyMT tumour cell line transduced with the indicated shRNA expression vectors. The shLuciferase (shLuc) shRNA was used as a control. (c) Western blot confirming SLUG and SNAIL knockdown in MDA-MB-231 cells transduced with the indicated shRNA expression vectors. shLuc was used as a control. Uncropped western blots are enclosed in Supplemental Information. (d) Tumour-sphere formation efficiencies (# tumourspheres/1000 cells for MDA-MB-361 cells, and # tumourspheres/200 cells for all the other cell lines) of the indicated human breast cancer cells transduced with shSLUG#2, shSNAIL#2, and the shLuc control (mean + s.d., n = 5 technical replicates/group). Data represent two independent experiments. (e, f) SUM159 (e) and SUM149 (f) cells transduced with the indicated shRNAs were injected subcutaneously at limiting dilutions to score primary tumour formation. Tumour-initiation were scored and presented as (# of tumour incidences/# of injections). Data represent two independent experiments. (g) The organoid forming efficiencies of normal MECs transduced with the indicated shRNA expression vectors (mean ± s.d., n =6 technical replicates/group, *p<0.001, N.S. not significant.). Scale bar 100 μm. Data represent three independent experiments.
Extended data figure 10
Extended data figure 10. Slug and Snail occupy different genomic regions
(a) Western blots showing expression of EMT-TFs and EMT markers in the PyMT tumour cell lines used for the ChIP-seq analyses.Uncropped western blots are enclosed in Supplemental Information. Data represent three independent experiments (b) Pulmonary metastases formed by 100,000 cells of the indicated cell lines following tail-vein injection. (n = 9 animals/group) Source data are enclosed in Source Data T4. (c) Box-plot showing distributions of fold enrichment of all peaks identified in Snail ChIP and Slug ChIP. (d) Sample top motifs enriched around the summits of the α-Snail and α-Slug ChIP peaks. (e) Sample ChIP-seq signals for Slug and Snail are shown. Left column shows promoters bound by Slug only. Right column shows promoters bound by Snail only. Arrows indicate the directions of transcription. (f) MCF10A human mammary epithelial cells were transduced with rtTA and SNAIL driven by a tet-on promoter, untreated (left panel) or treated with 2 μg/ml doxycycline (dox) for 48h (right panel), and stained for E-cad (green) and ZEB1 (red). Scale bar 20 μm. Data represent five independent experiments.
Figure 1
Figure 1. Differential expression of Slug and Snail in normal mammary glands
(a, b) Targeting strategies for the knock-in alleles. (c, d) Normal mammary glands of the indicated genotypes were stained for the indicated proteins. (e) FACS histograms showing relative expression levels of the YFP reporters in normal adult mammary cell subpopulations. (f) Normal mammary gland stained for E-cad and Slug. Arrowheads indicate the junctions between basal MECs. Quantifications of Anti-E-cad staining intensities at the junctions between luminal MECs and basal MECs in a representative mammary gland (mean ± s.d., n = 20, cell junctions, * p<0.00001). Data represent analyses of six glands. (g) Representative qRT-PCR quantification of the indicated EMT markers (mean + s.e.m., technical triplicates). Levels in luminal MECs were set to one. Data represent three independent experiments. All scale bars 20 μm.
Figure 2
Figure 2. Differential expression of Slug and Snail in mammary tumours
(a, b) Hyperplastic mammary lesions of the indicated genotypes were stained for the indicated proteins. Arrow in (a) indicates Snail-YFP and CK8 double-positive cells. Arrows and arrowheads in (b) indicate Snail-YFP and cytokeratin double-positive cells and Slug-positive cells respectively. (c, d) High-grade carcinomas of the indicated genotypes were stained for the indicated proteins. Arrows indicate Zeb1 and cytokeratin double-positive cells (c) and the junctions between YFP-positive carcinoma cells (d). (e) SnailYFP/+;MMTV-PyMT tumours were stained for the indicated proteins. Arrows indicate Snail-YFP-positive carcinoma cells. (f) Tumour organoids of the indicated genotypes were stained for the indicated proteins. Images represent three independent experiments. All scale bars 10 μm.
Figure 3
Figure 3. Breast TICs express Snail
(a) Schematic of the transplantation model. (b, c) FACS profiles of the high-grade carcinomas of the indicated genotypes. (d, e) Representative qRT-PCR analyses of the expressions of EMT markers (mean + s.e.m., technical triplicates) in indicated subpopulations of high-grade carcinomas derived from SlugYFP/+;MMTV-PyMT;RFP (d) and SnailYFP/+;MMTV-PyMT;RFP MECs (e). Expression levels in Slug-YFPloEpCAMhi cells and Snail-YFPloEpCAMhi cells were set to one. (d, e) represent three independent experiments. (f, g) Metastatic outgrowths generated by indicated subpopulations following tail vein injection. * p<0.0001 (g) and following sub-cutaneous implantation. * p=0.019 (h) (mean + s.d., n = 5 animals/group). N.S. not significant. (f) and (g) represent four and three independent experiments respectively. Source data are enclosed in Source Data T1.
Figure 4
Figure 4. Depletion of Snail selectively affects breast TICs
(a, b) Immunofluorescence images of the shRNA-transduced pBl.3G cells (a) and MDA-MB-231 cells (b). Scale bars 20 μm. (c, d) Primary tumour burdens and pulmonary metastases formed by orthotopically implanted pBl.3G cells (c, unilateral implantation, n = 5 animals/group, *p=0.026, **p=1.9×10⁻⁵) and MDA-MB-231 cells (d, bilateral implantation, n = 5 animals/group *p<0.01, **p<0.001). N.S. not significant. Source data are enclosed in Source Data T2. (e) Fluorescent images of wholemount lungs showing spontaneously metastases formed by the orthotopically implanted GFP-labeled MDA-MB-231 cells. (f) Wholemount fluorescent images of the mammary fat pads implanted with the indicated GFP-expressing primary murine MECs. Scale bar 1 mm.
Figure 5
Figure 5. Slug and Snail control different targets
(a) Distribution of summits of all Snail ChIP-seq and Slug ChIP-seq peaks. TSS: transcription start site, TES: transcription end site. (b) Venn diagram showing the numbers of promoters occupied by Slug and Snail. (c) GSEA analyses of published EMT-related datasets for Snail-bound and Slug-bound genes. (d) ChIP-seq signals for Slug and Snail at the Zeb1 locus. Arrows indicate TSSs. (e-g) Fold-enrichment of SLUG and SNAIL binding at the ZEB1 promoter relative to background measured by ChIP–qPCR (mean + s.e.m., technical triplicates). Data represent two independent experiments.

References

    1. Al-Hajj M, Clarke MF. Self-renewal and solid tumor stem cells. Oncogene. 2004;23:7274–7282. doi:10.1038/sj.onc.1207947. - PubMed
    1. O'Brien CA, Kreso A, Dick JE. Cancer stem cells in solid tumors: an overview. Seminars in radiation oncology. 2009;19:71–77. doi:10.1016/j.semradonc.2008.11.001. - PubMed
    1. Visvader JE, Lindeman GJ. Cancer stem cells: current status and evolving complexities. Cell Stem Cell. 2012;10:717–728. doi:10.1016/j.stem.2012.05.007. - PubMed
    1. Chaffer CL, et al. Normal and neoplastic nonstem cells can spontaneously convert to a stem-like state. Proc Natl Acad Sci U S A. 2011;108:7950–7955. doi:10.1073/pnas.1102454108. - PMC - PubMed
    1. Gupta PB, et al. Stochastic state transitions give rise to phenotypic equilibrium in populations of cancer cells. Cell. 2011;146:633–644. doi:10.1016/j.cell.2011.07.026. - PubMed

Publication types

MeSH terms

Associated data