. 2015 Nov:485:330-9.
doi: 10.1016/j.virol.2015.08.010. Epub 2015 Aug 29.

Severe acute respiratory syndrome coronavirus E protein transports calcium ions and activates the NLRP3 inflammasome

Affiliations

Severe acute respiratory syndrome coronavirus E protein transports calcium ions and activates the NLRP3 inflammasome

Jose L Nieto-Torres et al. Virology. 2015 Nov.

Abstract

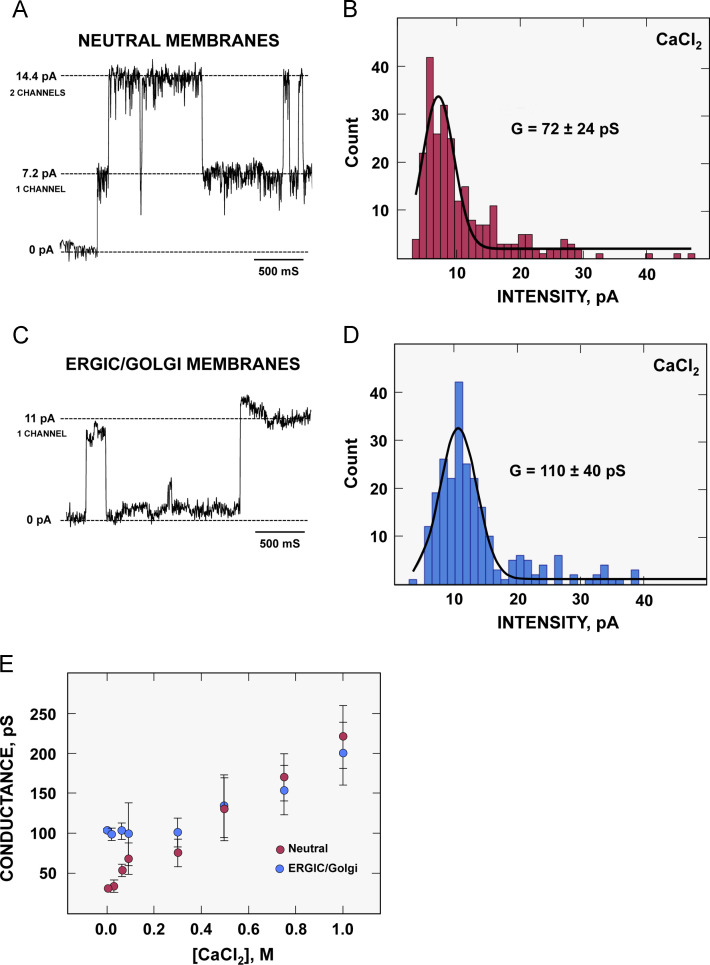
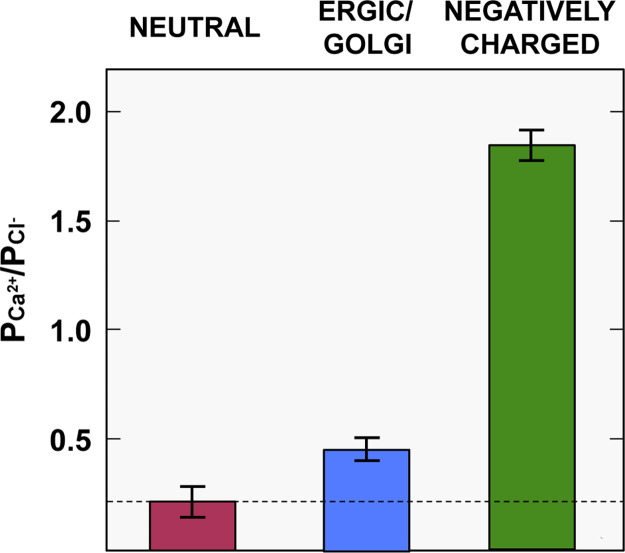
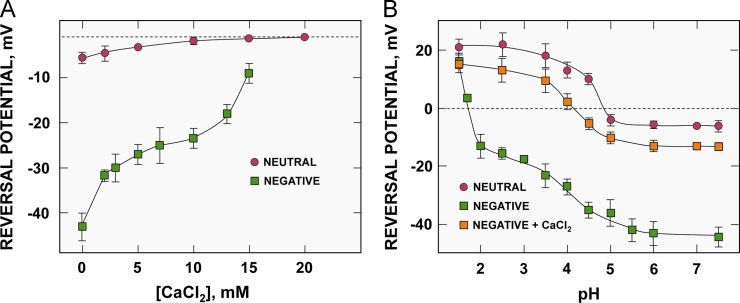
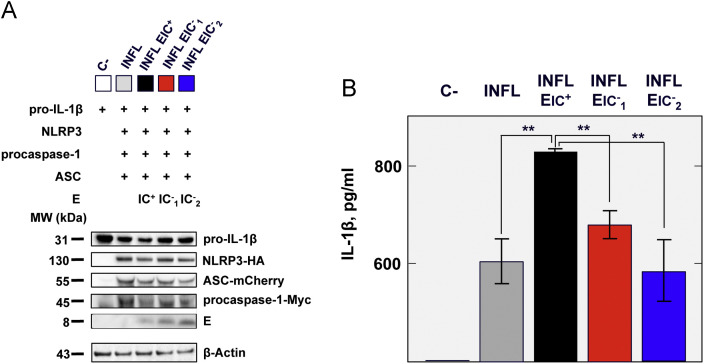
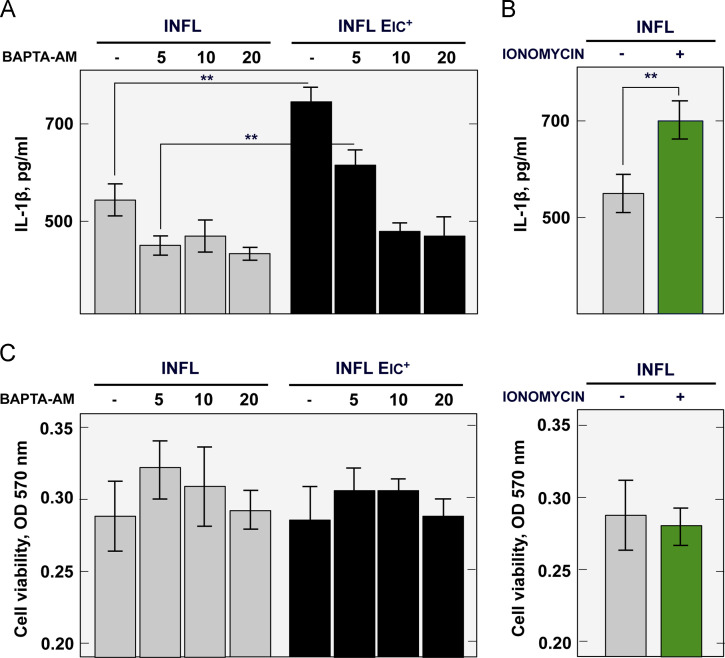
Severe acute respiratory syndrome coronavirus (SARS-CoV) envelope (E) protein is a viroporin involved in virulence. E protein ion channel (IC) activity is specifically correlated with enhanced pulmonary damage, edema accumulation and death. IL-1β driven proinflammation is associated with those pathological signatures, however its link to IC activity remains unknown. In this report, we demonstrate that SARS-CoV E protein forms protein-lipid channels in ERGIC/Golgi membranes that are permeable to calcium ions, a highly relevant feature never reported before. Calcium ions together with pH modulated E protein pore charge and selectivity. Interestingly, E protein IC activity boosted the activation of the NLRP3 inflammasome, leading to IL-1β overproduction. Calcium transport through the E protein IC was the main trigger of this process. These findings strikingly link SARS-CoV E protein IC induced ionic disturbances at the cell level to immunopathological consequences and disease worsening in the infected organism.

Keywords: Calcium; Coronavirus; E protein; Inflammasome; Ion channel; Pathogenesis; SARS-CoV; Viroporin.


Figures

Fig. 1
Fig. 1
SARS-CoV E protein IC activity in CaCl2 solutions. (A) Current recordings showing intensity jumps (measured in pA) corresponding to the assembly and disassembly of one or several channels in neutral DPhPC membranes. (B) Histogram representing the intensity of the different current jumps recorded and their respective frequency in neutral membranes. Conductance (G), which is the ratio between current intensity and the applied voltage, is also indicated (measured in pS). Current jumps (C) and their corresponding histogram (D) measured in ERGIC/Golgi membranes. (E) Single-channel conductance variation in solutions containing increasing concentrations of CaCl2. Magenta circles represent data from neutral membranes and blue circles values from ERGIC/Golgi membranes. Error bars show standard deviations from three independent experiments.
Fig. 2
Fig. 2
Ca2+ selectivity of SARS-CoV E protein channel. Permeability ratios PCa2+/PCl in neutral DPhPC (magenta column), ERGIC/Golgi (blue column) or negatively-charged DPhPS membranes (green column). Dotted line represents the permeability ratio value for a hypothetical neutral pore. Values above the line represent cation selectivity, and those below correspond to anion selectivity. Error bars show standard deviations.
Fig. 3
Fig. 3
Modulation of SARS-CoV E protein channel selectivity by Ca2+. (A) Reversal potential (Erev) was measured in asymmetric (500 mM | 50 mM) KCl solutions upon addition of millimolar CaCl2 concentrations. Two series of experiments were performed: in neutral DPhPC (magenta circles) and negatively charged DPhPS membranes (green squares). Dotted line shows Erev value corresponding to a non-selective ion channel. (B) Effect of pH on E protein Erev measured under the same KCl conditions above mentioned in neutral (magenta circles) and negatively charged membranes in the absence (green squares) or the presence of 15 mM CaCl2 (orange squares). Dotted line shows the Erev value corresponding to a non-selective ion channel. Error bars represent standard deviations from three independent experiments.
Fig. 4
Fig. 4
Mutations inhibiting SARS-CoV E protein conductance in CaCl2. Single channel conductance was measured in 100 mM CaCl2, in the absence of any peptide (C−, gray column), or in the presence of wildtype SARS-CoV E protein transmembrane domain peptide (WT, black column), or the mutant peptides N15A (red column) and V25F (blue column). Error bars represent standard deviations.
Fig. 5
Fig. 5
Inflammasome activation through SARS-CoV E protein ion channel activity. The components of the NLRP3 inflammasome (INFL), NLRP3 (NLRP3-HA), ASC (ASC-mCherry), procaspase-1 (procaspase-1-Myc) and pro-IL-1β were transfected in Vero E6 cells, in the absence or presence of SARS-CoV E protein with (IC+) or without (IC) ion channel activity. EIC1 represents the N15A mutant and EIC2 indicates the V25F mutant. As a negative control, cells were transfected solely with pro-IL-1β (C−). (A) Western blot showing the presence of the inflammasome complex components and E protein within Vero E6 cells lysates. β-Actin was also detected as a loading control. (B) Levels of active IL-1β present in the cell supernatant. Error bars represent standard deviations from three independent experiments. Statistically significant data are indicated with two asterisks (Student׳s t-test p value<0.01).
Fig. 6
Fig. 6
Inflammasome activation through SARS-CoV E protein Ca2+ channel activity. (A) The inflammasome complex (INFL) was reconstituted in cells without or with wildtype E protein (EIC+) in the presence of increasing concentrations (μM) of the cell permeable Ca2+ chelator BAPTA-AM. DMSO was added as negative control (−). The levels of active IL-1β present in the cell media were measured by ELISA. (B) Activation of the inflammasome by the Ca2+ ionophore ionomycin. Error bars represent standard deviations from three independent experiments; statistically significant data are indicated with two asterisks (Student׳s t-test p value<0.01). (C) Cell viability MTT assay. Optical densities (OD) representing cellular metabolic activity under the different experimental conditions were measured at 570 nm.

References

    1. Alcaraz A., Nestorovich E.M., Lopez M.L., Garcia-Gimenez E., Bezrukov S.M., Aguilella V.M. Diffusion, exclusion, and specific binding in a large channel: a study of OmpF selectivity inversion. Biophys. J. 2009;96:56–66. - PMC - PubMed
    1. Almazan F., DeDiego M.L., Sola I., Zuñiga S., Nieto-Torres J.L., Marquez-Jurado S., Andres G., Enjuanes L. Engineering a replication-competent, propagation-defective Middle East respiratory syndrome coronavirus as a vaccine candidate. mBio. 2013;4:e00650–00613. - PMC - PubMed
    1. Annan A., Baldwin H.J., Corman V.M., Klose S.M., Owusu M., Nkrumah E.E., Badu E.K., Anti P., Agbenyega O., Meyer B., Oppong S., Sarkodie Y.A., Kalko E.K., Lina P.H., Godlevska E.V., Reusken C., Seebens A., Gloza-Rausch F., Vallo P., Tschapka M., Drosten C., Drexler J.F. Human betacoronavirus 2c EMC/2012-related viruses in Bats, Ghana and Europe. Emerg. Infect. Dis. 2013;19:456–459. - PMC - PubMed
    1. Campanella M., de Jong A.S., Lanke K.W., Melchers W.J., Willems P.H., Pinton P., Rizzuto R., van Kuppeveld F.J. The coxsackievirus 2B protein suppresses apoptotic host cell responses by manipulating intracellular Ca2+ homeostasis. J. Biol. Chem. 2004;279:18440–18450. - PubMed
    1. Chandra S., Kable E.P., Morrison G.H., Webb W.W. Calcium sequestration in the Golgi apparatus of cultured mammalian cells revealed by laser scanning confocal microscopy and ion microscopy. J. Cell Sci. 1991;100:747–752. - PubMed

Publication types

MeSH terms