

Ethanol Effect on BK Channels is Modulated by Magnesium
- PMID: 26331878
- PMCID: PMC4607927
- DOI: 10.1111/acer.12821
Ethanol Effect on BK Channels is Modulated by Magnesium
Abstract
Background: Alcoholics have been reported to have reduced levels of magnesium in both their extracellular and intracellular compartments. Calcium-dependent potassium channels (BK) are known to be one of ethanol (EtOH)'s better known molecular targets.
Methods: Using outside-out patches from hippocampal neuronal cultures, we examined the consequences of altered intracellular Mg(2+) on the effects that EtOH has on BK channels.
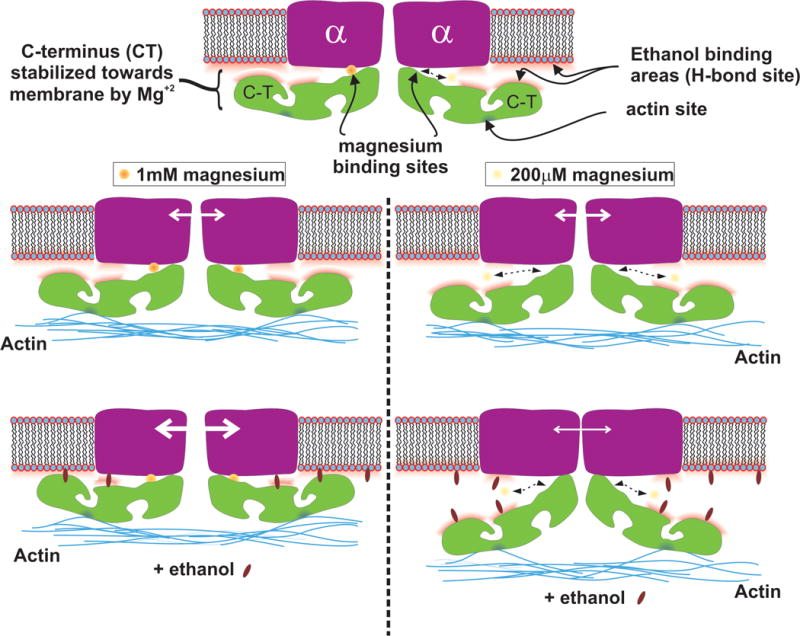
Results: We find that the effect of EtOH is bimodally influenced by the Mg(2+) concentration on the cytoplasmic side. More specifically, when internal Mg(2+) concentrations are ≤200 μM, EtOH decreases BK activity, whereas it increases activity when Mg(2+) is at 1 mM. Similar results are obtained when using patches from HEK cells expressing only the α-subunit of BK. When patches are made with the actin destabilizer cytochalasin D present on the cytoplasmic side, the potentiation caused by EtOH becomes independent of the Mg(2+) concentration. Furthermore, in the presence of the actin stabilizer phalloidin, EtOH causes inhibition even at Mg(2+) concentrations of 1 mM.
Conclusions: Internal Mg(2+) can modulate the EtOH effects on BK channels only when there is an intact, internal actin interaction with the channel, as is found at synapses. We propose that the EtOH-induced decrease in cytoplasmic Mg(2+) observed in frequent/chronic drinkers would decrease EtOH's actions on synaptic (e.g., actin-bound) BK channels, producing a form of molecular tolerance.
Keywords: BK Channel; Ethanol; Magnesium.
Copyright © 2015 by the Research Society on Alcoholism.
Figures


Similar articles
-
Time-Dependent Effects of Ethanol on BK Channel Expression and Trafficking in Hippocampal Neurons.Alcohol Clin Exp Res. 2015 Sep;39(9):1619-31. doi: 10.1111/acer.12808. Epub 2015 Aug 6. Alcohol Clin Exp Res. 2015. PMID: 26247146 Free PMC article.
-
Ethanol increases the activity of Ca(++)-dependent K+ (mslo) channels: functional interaction with cytosolic Ca++.J Pharmacol Exp Ther. 1998 Jan;284(1):258-68. J Pharmacol Exp Ther. 1998. PMID: 9435186
-
Leptin-induced dynamic alterations in the actin cytoskeleton mediate the activation and synaptic clustering of BK channels.FASEB J. 2005 Nov;19(13):1917-9. doi: 10.1096/fj.05-4166fje. Epub 2005 Sep 15. FASEB J. 2005. PMID: 16166199
-
Ethanol interactions with calcium-dependent potassium channels.Alcohol Clin Exp Res. 2007 Oct;31(10):1625-32. doi: 10.1111/j.1530-0277.2007.00469.x. Alcohol Clin Exp Res. 2007. PMID: 17850640 Review.
-
Commentary: alcohol depletion of magnesium: a new mechanism for tolerance to alcohol activation of BK channels?Alcohol Clin Exp Res. 2015 Nov;39(11):2095-6. doi: 10.1111/acer.12857. Epub 2015 Sep 1. Alcohol Clin Exp Res. 2015. PMID: 26332707 Review. No abstract available.
Cited by
-
Modulation of BK Channels by Ethanol.Int Rev Neurobiol. 2016;128:239-79. doi: 10.1016/bs.irn.2016.03.019. Epub 2016 May 12. Int Rev Neurobiol. 2016. PMID: 27238266 Free PMC article. Review.
-
Comparative mRNA profile analysis from NAc of adolescent male mice after binge-like alcohol exposure eliciting deficits in context fear extinction learning.PLoS One. 2025 Jun 25;20(6):e0322576. doi: 10.1371/journal.pone.0322576. eCollection 2025. PLoS One. 2025. PMID: 40560842 Free PMC article.
-
BK ZERO isoform HEK293 stably transfected cell lines differing 3'UTRs to assess miR-9 regulation.PLoS One. 2024 Mar 19;19(3):e0298966. doi: 10.1371/journal.pone.0298966. eCollection 2024. PLoS One. 2024. PMID: 38502673 Free PMC article.
-
BK channels and alcohol tolerance: Insights from studies on Drosophila, nematodes, rodents and cell lines: A systematic review.Med Int (Lond). 2025 Apr 2;5(4):33. doi: 10.3892/mi.2025.232. eCollection 2025 Jul-Aug. Med Int (Lond). 2025. PMID: 40236633 Free PMC article.
-
BK Channels in the Central Nervous System.Int Rev Neurobiol. 2016;128:281-342. doi: 10.1016/bs.irn.2016.04.001. Epub 2016 May 13. Int Rev Neurobiol. 2016. PMID: 27238267 Free PMC article. Review.
References
-
- Allansson L, Khatibi S, Olsson T, Hansson E. Acute ethanol exposure induces [Ca2+]i transients, cell swelling and transformation of actin cytoskeleton in astroglial primary cultures. J Neurochem. 2001;76(2):472–9. - PubMed
-
- Altura BM, Altura BT. Association of alcohol in brain injury, headaches and stroke with brain-tissue and serum levels of ionized magnesium: A review of recent-findings and mechanisms of action. Alcohol. 1999;19:111–130. - PubMed
-
- Babu AN, Cheng TP, Zhang A, Altura BT, Altura BM. Low concentrations of ethanol deplete type-2 astrocytes of intracellular free magnesium. Brain Res Bull. 1999;50(1):59–62. - PubMed
-
- Brainard AM, Miller AJ, Martens JR, England SK. Maxi-K channels localize to caveolae in human myometrium: a role for an actin-channel-caveolin complex in the regulation of myometrial smooth muscle K+ current. Am J Physiol Cell Physiol. 2005;289:C49–C57. - PubMed
-
- Brown RA, Ilg KJ, Chen AF, Ren J. Dietary Mg(2+) supplementation restores impaired vasoactive responses in isolated rat aorta induced by chronic ethanol consumption. Eur J Pharmacol. 2002;442(3):241–50. - PubMed
Publication types
MeSH terms
Substances
Grants and funding
LinkOut - more resources
Full Text Sources
Other Literature Sources
Miscellaneous
