. 2015 Oct 7;140(19):6631-42.
doi: 10.1039/c5an00688k.

Exosomes: improved methods to characterize their morphology, RNA content, and surface protein biomarkers

Affiliations

Exosomes: improved methods to characterize their morphology, RNA content, and surface protein biomarkers

Yueting Wu et al. Analyst. .

Abstract

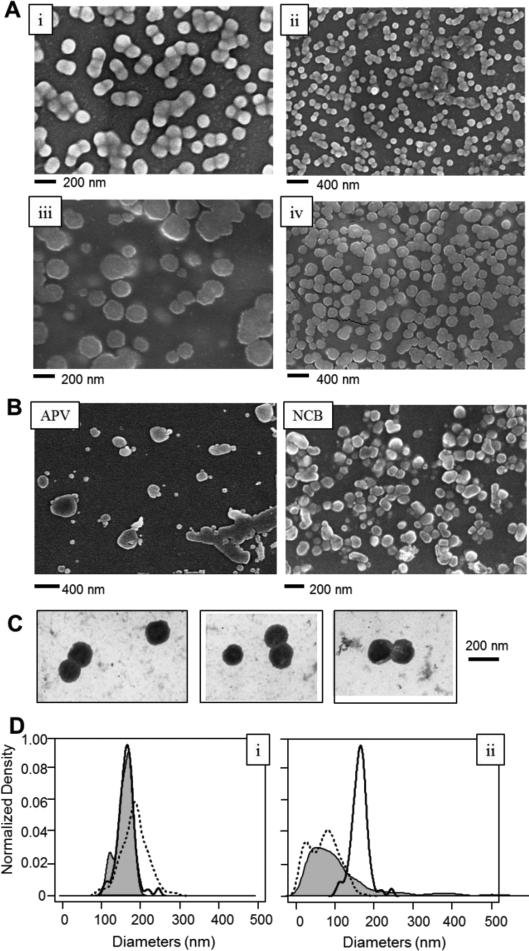
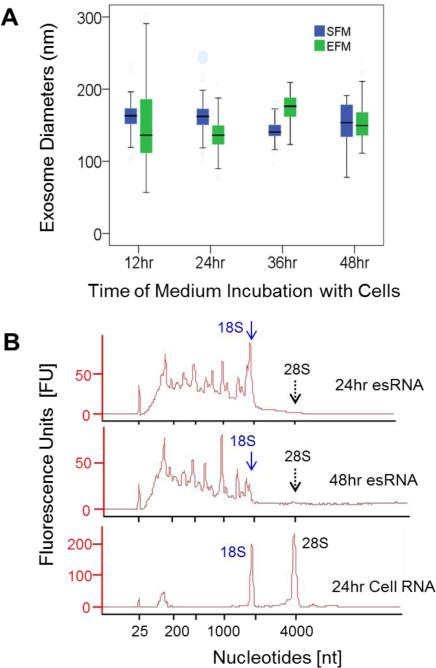
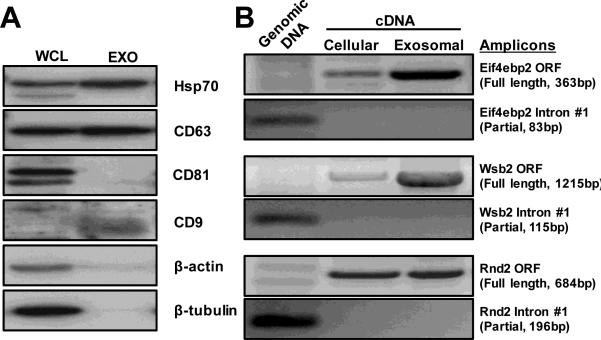
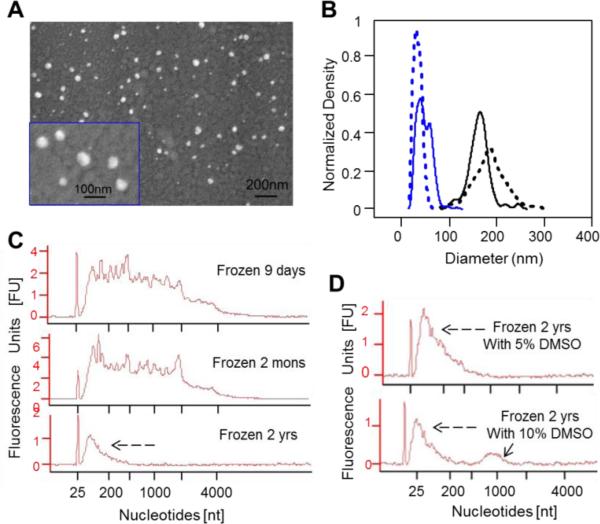
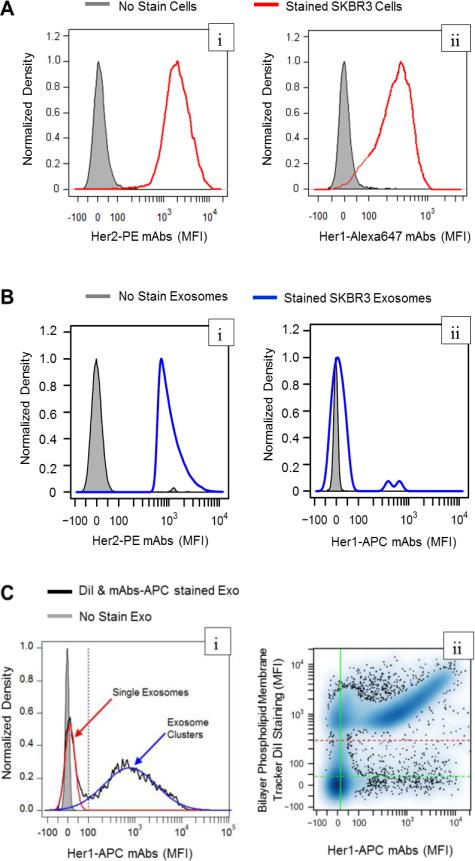
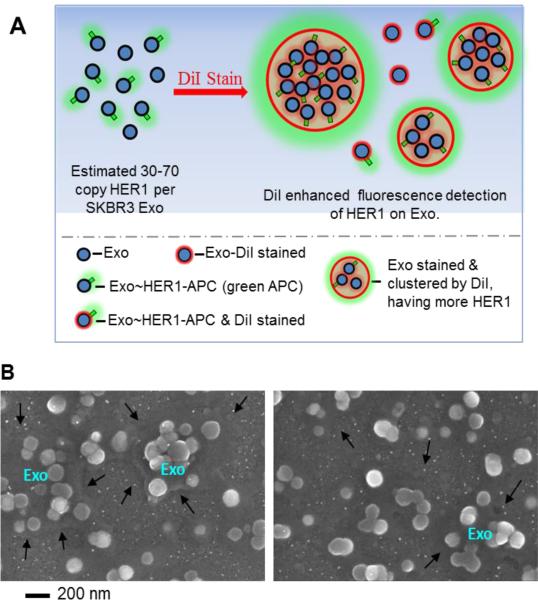
As a type of secreted membrane vesicle, exosomes are an emerging mode of cell-to-cell communication. Yet as exosome samples are commonly contaminated with other extracellular vesicles, the biological roles of exosomes in regulating immunity and promoting oncogenesis remain controversial. Wondering whether existing methods could distort our view of exosome biology, we compared two direct methods for imaging extracellular vesicles and quantified the impact of different production and storage conditions on the quality of exosome samples. Scanning electron microscopy (SEM) was compared to transmission electron microscopy (TEM) as alternatives to examine the morphology of exosomes. Using SEM, we were able to distinguish exosomes from other contaminating extracellular vesicles based on the size distribution. More importantly, freezing of samples prior to SEM imaging made it more difficult to distinguish exosomes from extracellular vesicles secreted during cell death. In addition to morphology, the quality of RNA contained within the exosomes was characterized under different storage conditions, where freezing of samples also degraded RNA. Finally, we developed a new flow cytometry approach to assay transmembrane proteins on exosomes. While high-copy-number proteins could be readily detected, detecting low-copy-number proteins was improved using a lipophilic tracer that clustered exosomes. To illustrate this, we observed that exosomes derived from SKBR3 cells, a cell model for human HER2+ breast cancer, contained both HER1 and HER2 but at different levels of abundance. Collectively, these new methods will help to ensure a consistent framework to identify specific roles that exosomes play in regulating cell-to-cell communication.


Figures

Figure 1
Figure 1
Different extracellular vesicles exhibited different morphologies and size distributions, as imagpd by SEM and TEM. (A) Exosomes (EXO) isolated from B16F0 mouse melanoma cells (subpanels i and ii) and SKBR3 human breast cancer cells (subpanels iii and iv) were imagpd by SEM. (B) Extracellular vesicles isolated from apoptotic B16F0 cells that were treated with 7-ethyl-10-hydroxycamptothecin (left panel, apoptotic vesicles APV). Necrotic bodies (NCB) were isolated from B16F0 cells following exposure to high shear conditions (right panel). APV and NCB were imagpd by SEM. (C) Exosomes from B16F0 cells were imagsd by TEM (scale bar = 200 nm). (D) The size distributions of EXO, APV, and NCB observed by electron microscopy, (left panel) B16F0 EXO observed by SEM (black solid line; n = 113) or TEM (gray shaded; n = 14), and SKBR3 EXO under SEM (dotted line; n = 237). (right panel) B16F0 vesicles observed by SEM, including EXO (black solid line; same data as in left panel), APV (gray shaded) and NCB (dotted line), All imagps were representative of a least three biological replicates. See Table 1 for comparisons and statistics.
Figure 2
Figure 2
Exosome quality was evaluated in terms of vesicle morphology and exosomal RNA as a function of production condtions. (A) B16F0 exosomes were produced using serum free medium (SFM) or exosome-free serum medium (EFM) for 12, 24, 36 and 48 hours and characterized using SEM (n = 51, 73, 76 and 53 for SFM exosomes, from 12-48 hrs,; n = 68, 213, 91, 210 for EFM exosomes, from 12-48 hrs, respectively). In the box plots, the top and bottom of the boxes indicate the 75% and 25% of the distribution in sizes, black bands on the boxes indicate the median sizes, top and bottom bars indicated the maximum and minimum of the sizes. The exosome sizes were assessed using two-way and one-way ANOVA and found to be not significantly different. Multiple SEM pictures and biological samples, n ≥ 3, were used to determine the exosome sizes. (B) Electrophoresis spectrums of exosomal and cellular RNA derived from B16F0 cells using Agilent Bioanalyzer. The positions of 18S and 28S peaks on the RNA spectrums were indicated in diagrams by arrows and labels. esRNAis for exosomal RNAs. Representative figures of RNA analy ses were shown, n > 3.
Figure 3
Figure 3
Biochemical characterization of exosomes from B16F0 cells. (A). Immunoblotting analysis of common exosome markers, where 20μg of total protein was loaded in each lane (WCL, whole cell lysate; Exo, exosome lysate). (B). Amplification of the full-length protein ORF s and partial introns by semi-quantitative RT-PCR suggested that a group of functional mRNAs are enriched in exosomes. 100ng of RNAs were reverse-transcribed into cDNA and subject to PCR amplification as indicated. 10ng of genomic DNA (10%) was also used as quality control (left lane).
Figure 4
Figure 4
Freezing of exosomes decreased their size and degraded exosomal RNA. (A) SEM pictures of B16F0 exosomes subjected to a freeze-and-thaw cycle. (B) The size distributions of frozen exosomes processed from B16F0 (blue solid line, diameter 44 ± 15 nm, n = 508) and SKBR3 (blue dotted line, diameter 34 ± 8 nm, n = 354) cells, in comparison with the fresh exosomes from B16F0 (black solid line, diameter 162 ± 23 nm, n = 113) and SKBR3 (black dotted line, diameter 183 ± 34 nm, n = 237) cells. The data for fresh exosomes are also shown in Figure 1D-i and Table 1. The sizes of the four exosome samples are statically different as assessed by one-way ANOVA (P value < 0.001). (C and D) Bioanalyzer results for exosomal RNAs isolated from exosomes frozen at −80 °C to −196 °C in media alone (C) or with 5-10% DM SO as cryoprotectant (D). Exosomes were stored frozen for 9 days (C top panel), 2 months (C middle panel), or 2 years (C bottom panel and D). The shift in nucleotide size towards small, degraded RNA is indicated by black dashed arrows. A hump around 1000 nt was observed in samples frozen for 2 years in 10% DM SO (solid arrow in D bottom panel). Representative figures were shown, n < 3 as for SEM of the biological samples; n<3 for RNA analysis and isolation.
Figure 5
Figure 5
The abundance of the membrane proteins, HER1 and HER2, were quantified on SKBR3 exosomes and the parental cells by flow cytometry. SKBR3 cells (A) and SKBR3 exosomes (B) were assayed for HER2 (left panels) and HER1 (right panels) abundance using fluorophore-conjugated antibodies and flow cytometry. Unstained exosomes and SKBR3 cells were used as negative controls (gray shaded). (C) Flow cytometric analysis of SKBR3 exosomes double-stained with APC-conjugated HER1 mAbs and DiI, a lipophilic fluorescent dye. (left panel: (i)) The density distribution of fluorescence associated with HER1 staining in DiI-positive events (black line) was bimodal and was deconvoluted into two normal distributions associated with single (red curve) and DiI-clustered exosomes (blue curve). The upper limit for APC-MFI of single exosomes is indicated by the gray vertical line. (right panel (ii)) A scatterplot of MFIs associated with HER1 staining versus DiI staining of SKBR3 exosome samples. The threshold to detect DiI-MFI is indicated by the red dashed horizontal line. The vertical green line indicates a data-driven threshold where 95 percent of unstained exosomes (gray shaded in left panel) exhibited a lower MFI associated with APC fluorescence.
Figure 6
Figure 6
Exosomes were clustered using the lipophilic tracer DiI. Exosome clusters had more HER1 copies and bigger particle sizes, which enhanced HER1 detection by conventional flow cytometry using anti HER1-APC mAbs. (A) A schematic diagram illustrating that DiI was used to cluster nanoscaled exosomes into microscaled clusters. (B) A representative SEM image of DiI clustered exosomes, where “Exo” indicates the clusters of exosomes and black arrows indicates the edges of microscaled clusters induced by DiI.

Similar articles

Cited by

References

    1. Théry C, Ostrowski M, Segura E. Nat. Rev. Immunol. 2009;9:581–593. - PubMed
    1. Andaloussi SEL, Mäger I, Breakefield XO, Wood MJ. Nat. Rev. Drug Discov. 2013;12:347–357. - PubMed
    1. Robbins PD, Morelli AE. Nat. Rev. Immunol. 2014;14:195–208. - PMC - PubMed
    1. Harding C, Heuser J, Stahl P. J. Cell Biol. 1983;97:329–339. - PMC - PubMed
    1. Pan BT, Teng K, Wu C, Adam M, Johnstone RM. J. Cell Biol. 1985;101:942–948. - PMC - PubMed

Publication types